Constraining & Calibrating the HWT Return Period
Goals:
- To validate the data driven return period flow used to visualize FIM.
- Scaffold out post-processing improvements.
Outcomes and Takeaways:
- A deeper appreciation for the forecast-to-operations process.
- A better grasp of the tangled dependencies of this wicked system.

Slide layout: default Items linked/bordered in green are cited in the tooltip on hover.
: narrative-oriented Items linked/bordered in blue are hyperlinked to relevant resources.
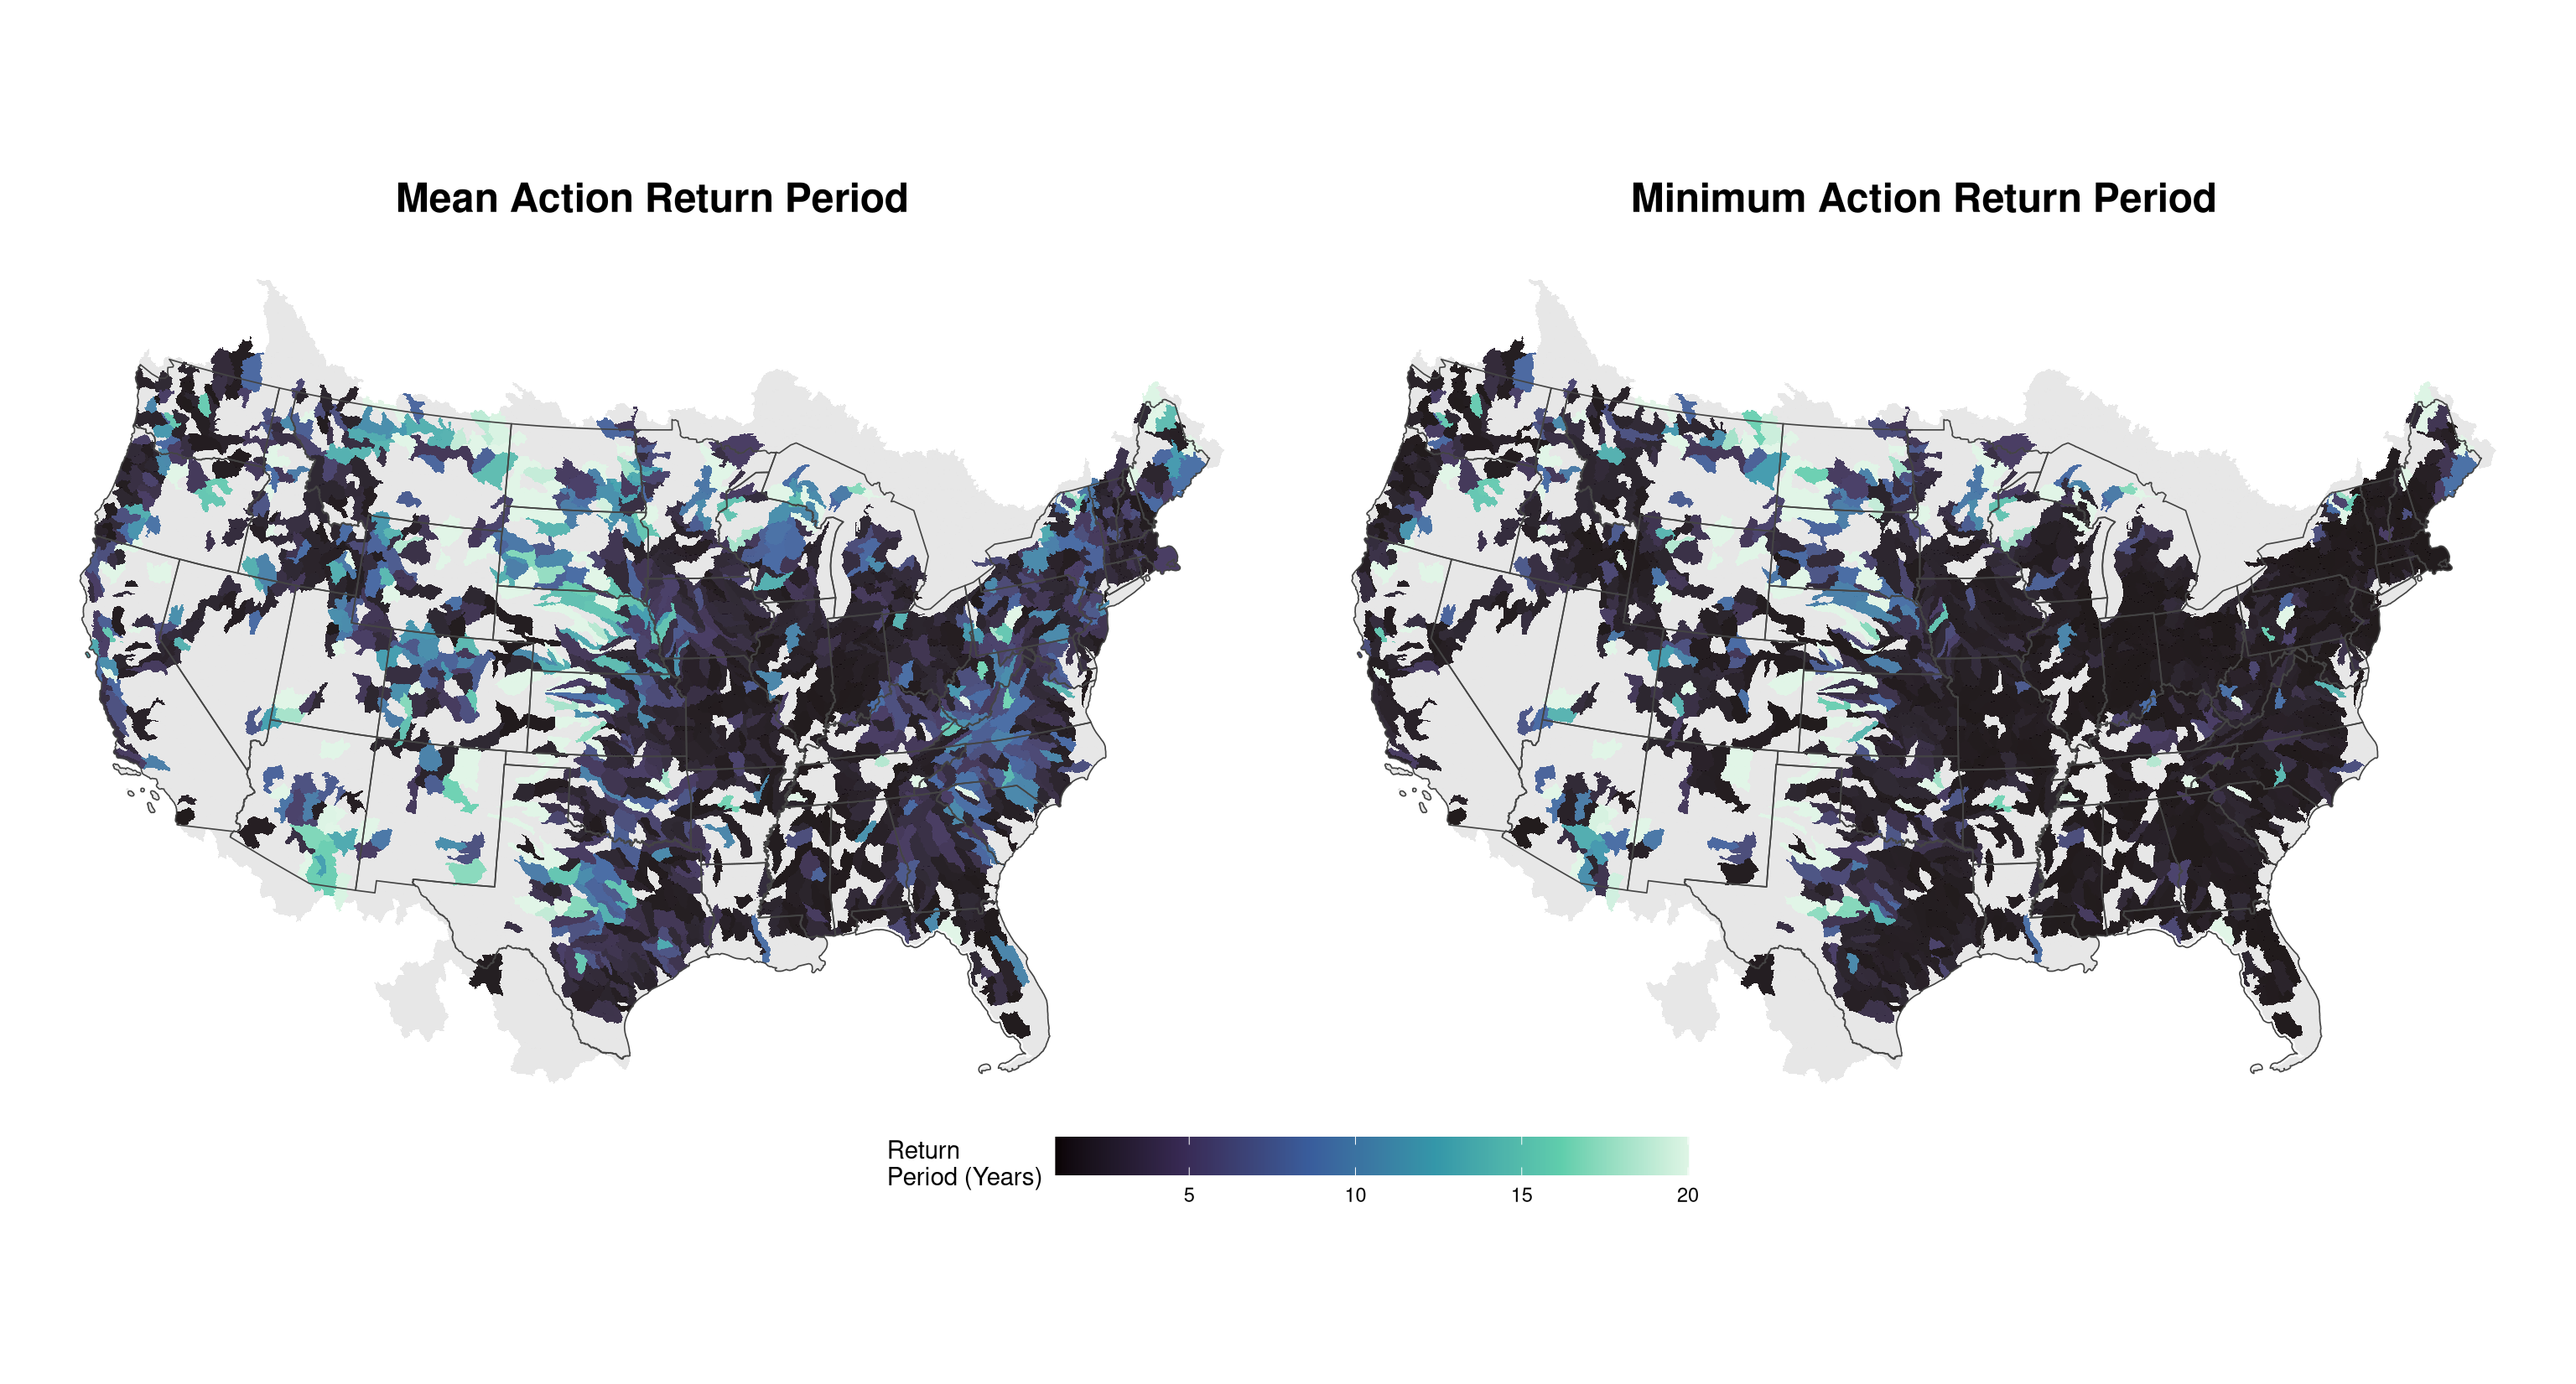
Directed clamps
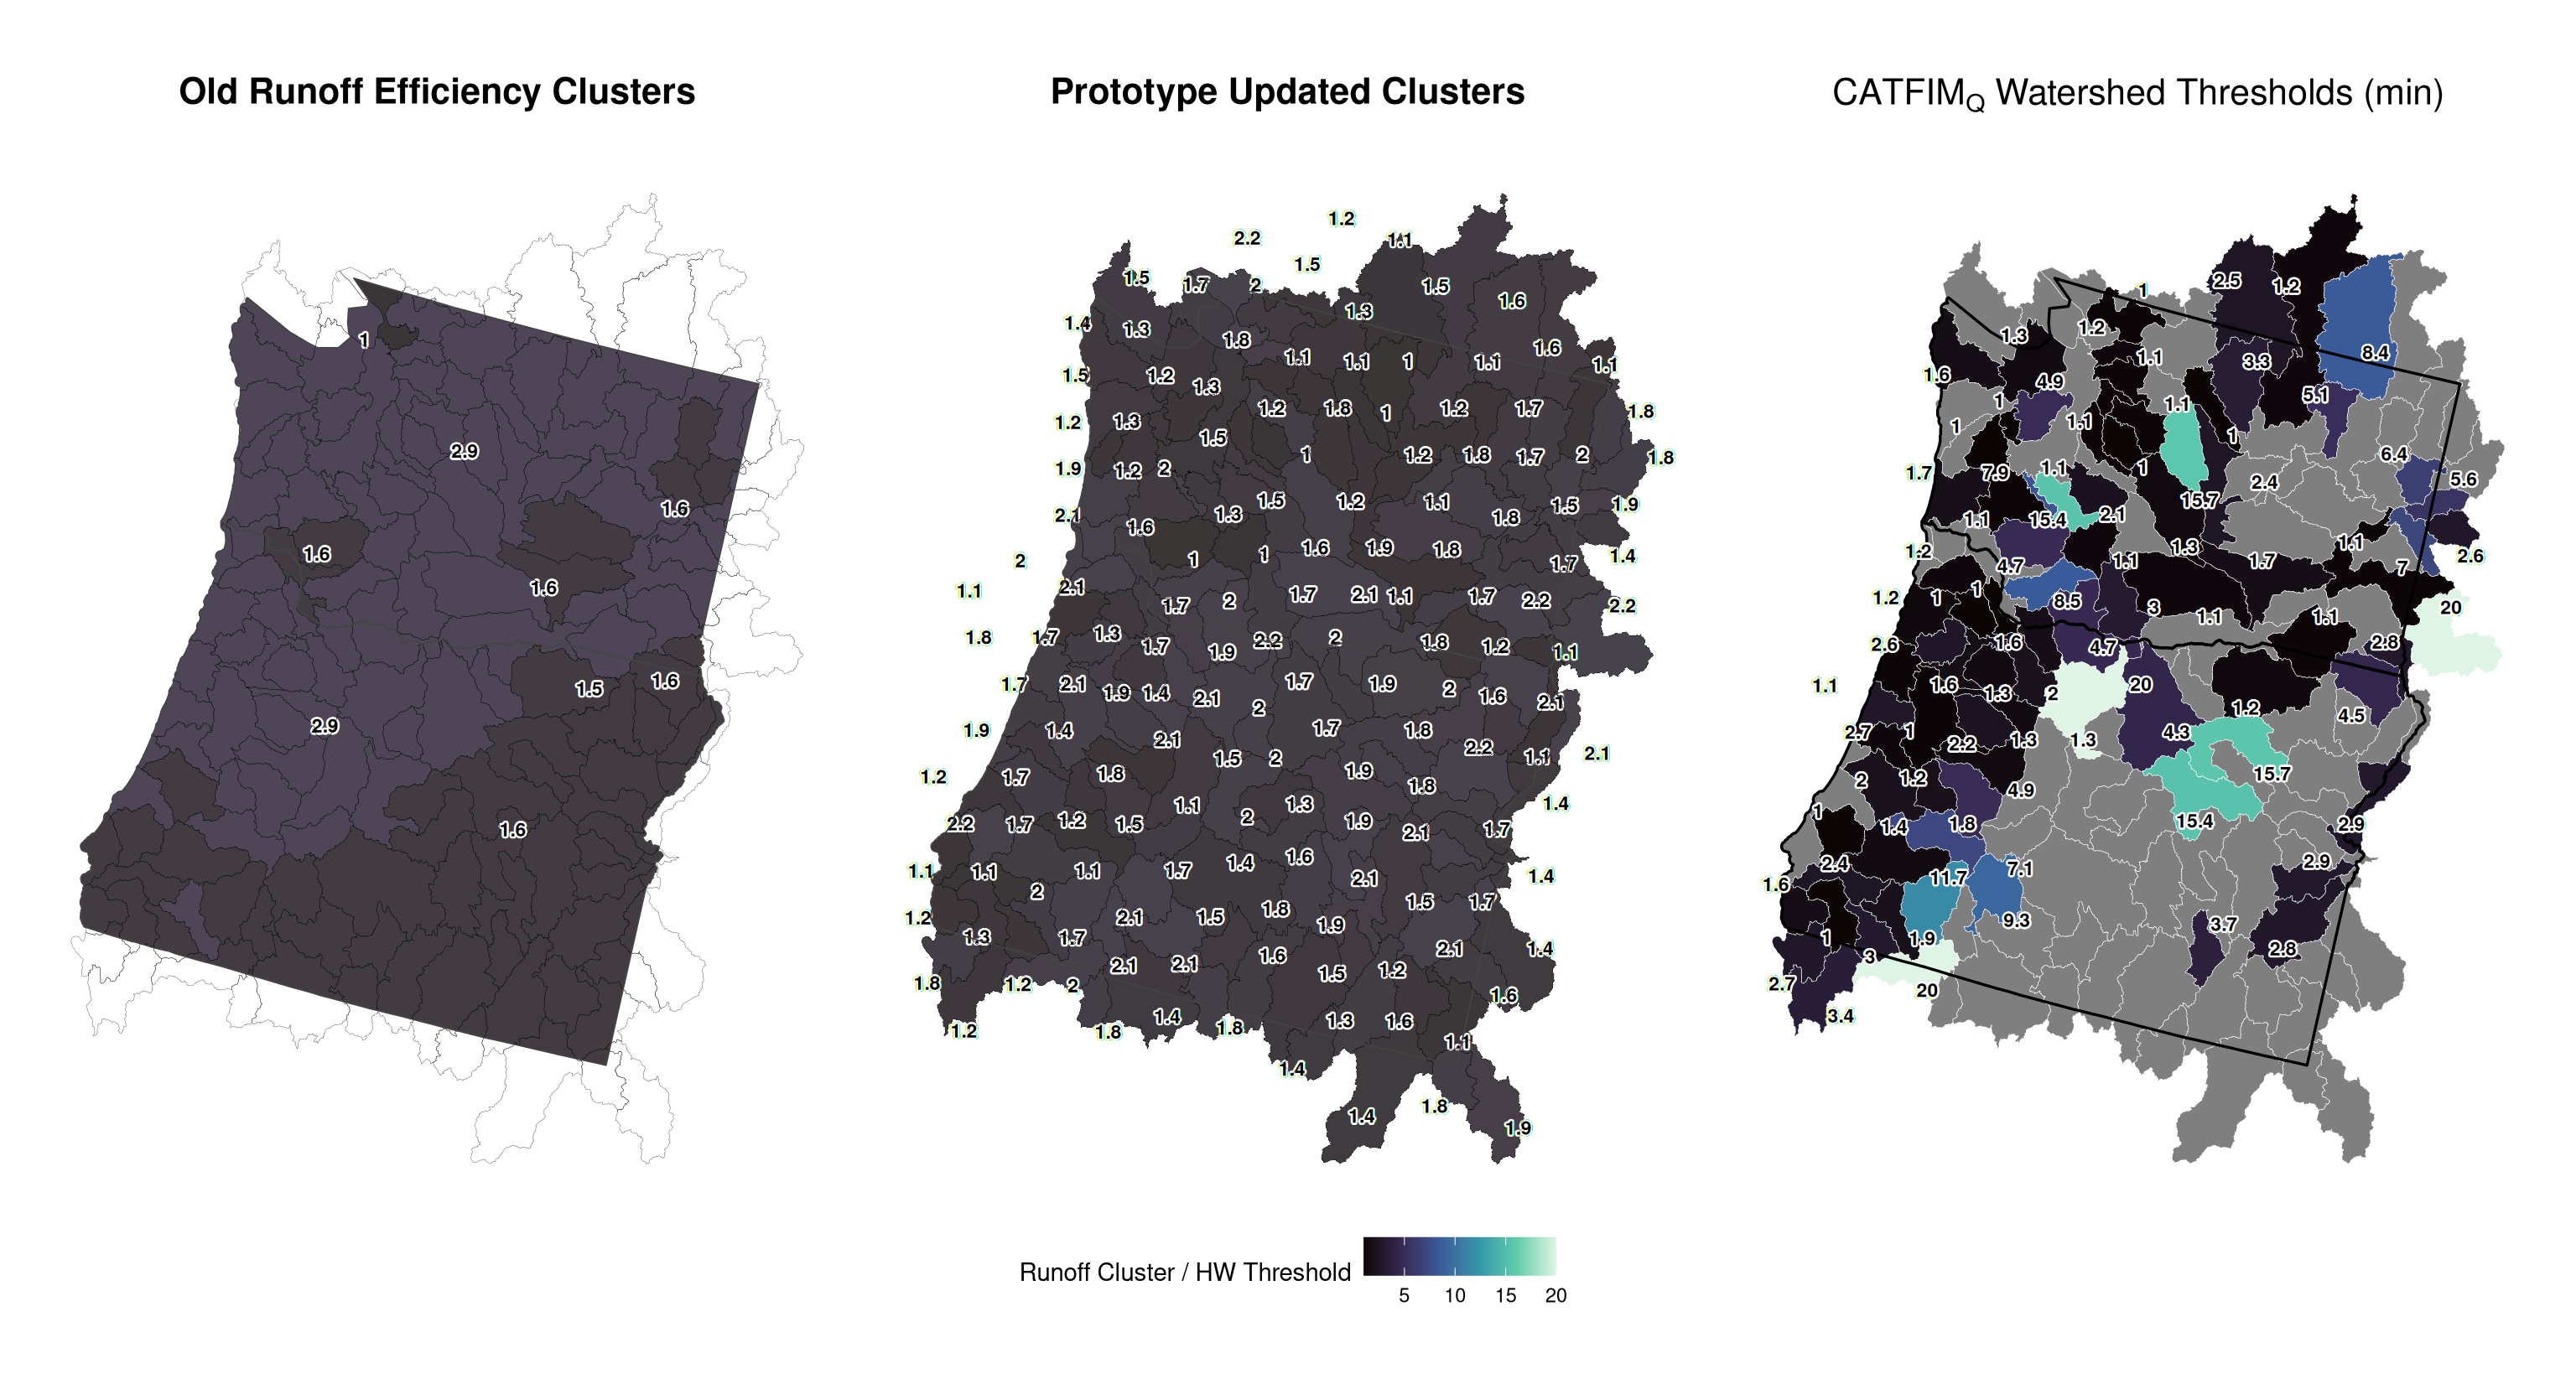
Regional breakdown: Pacific NorthWest
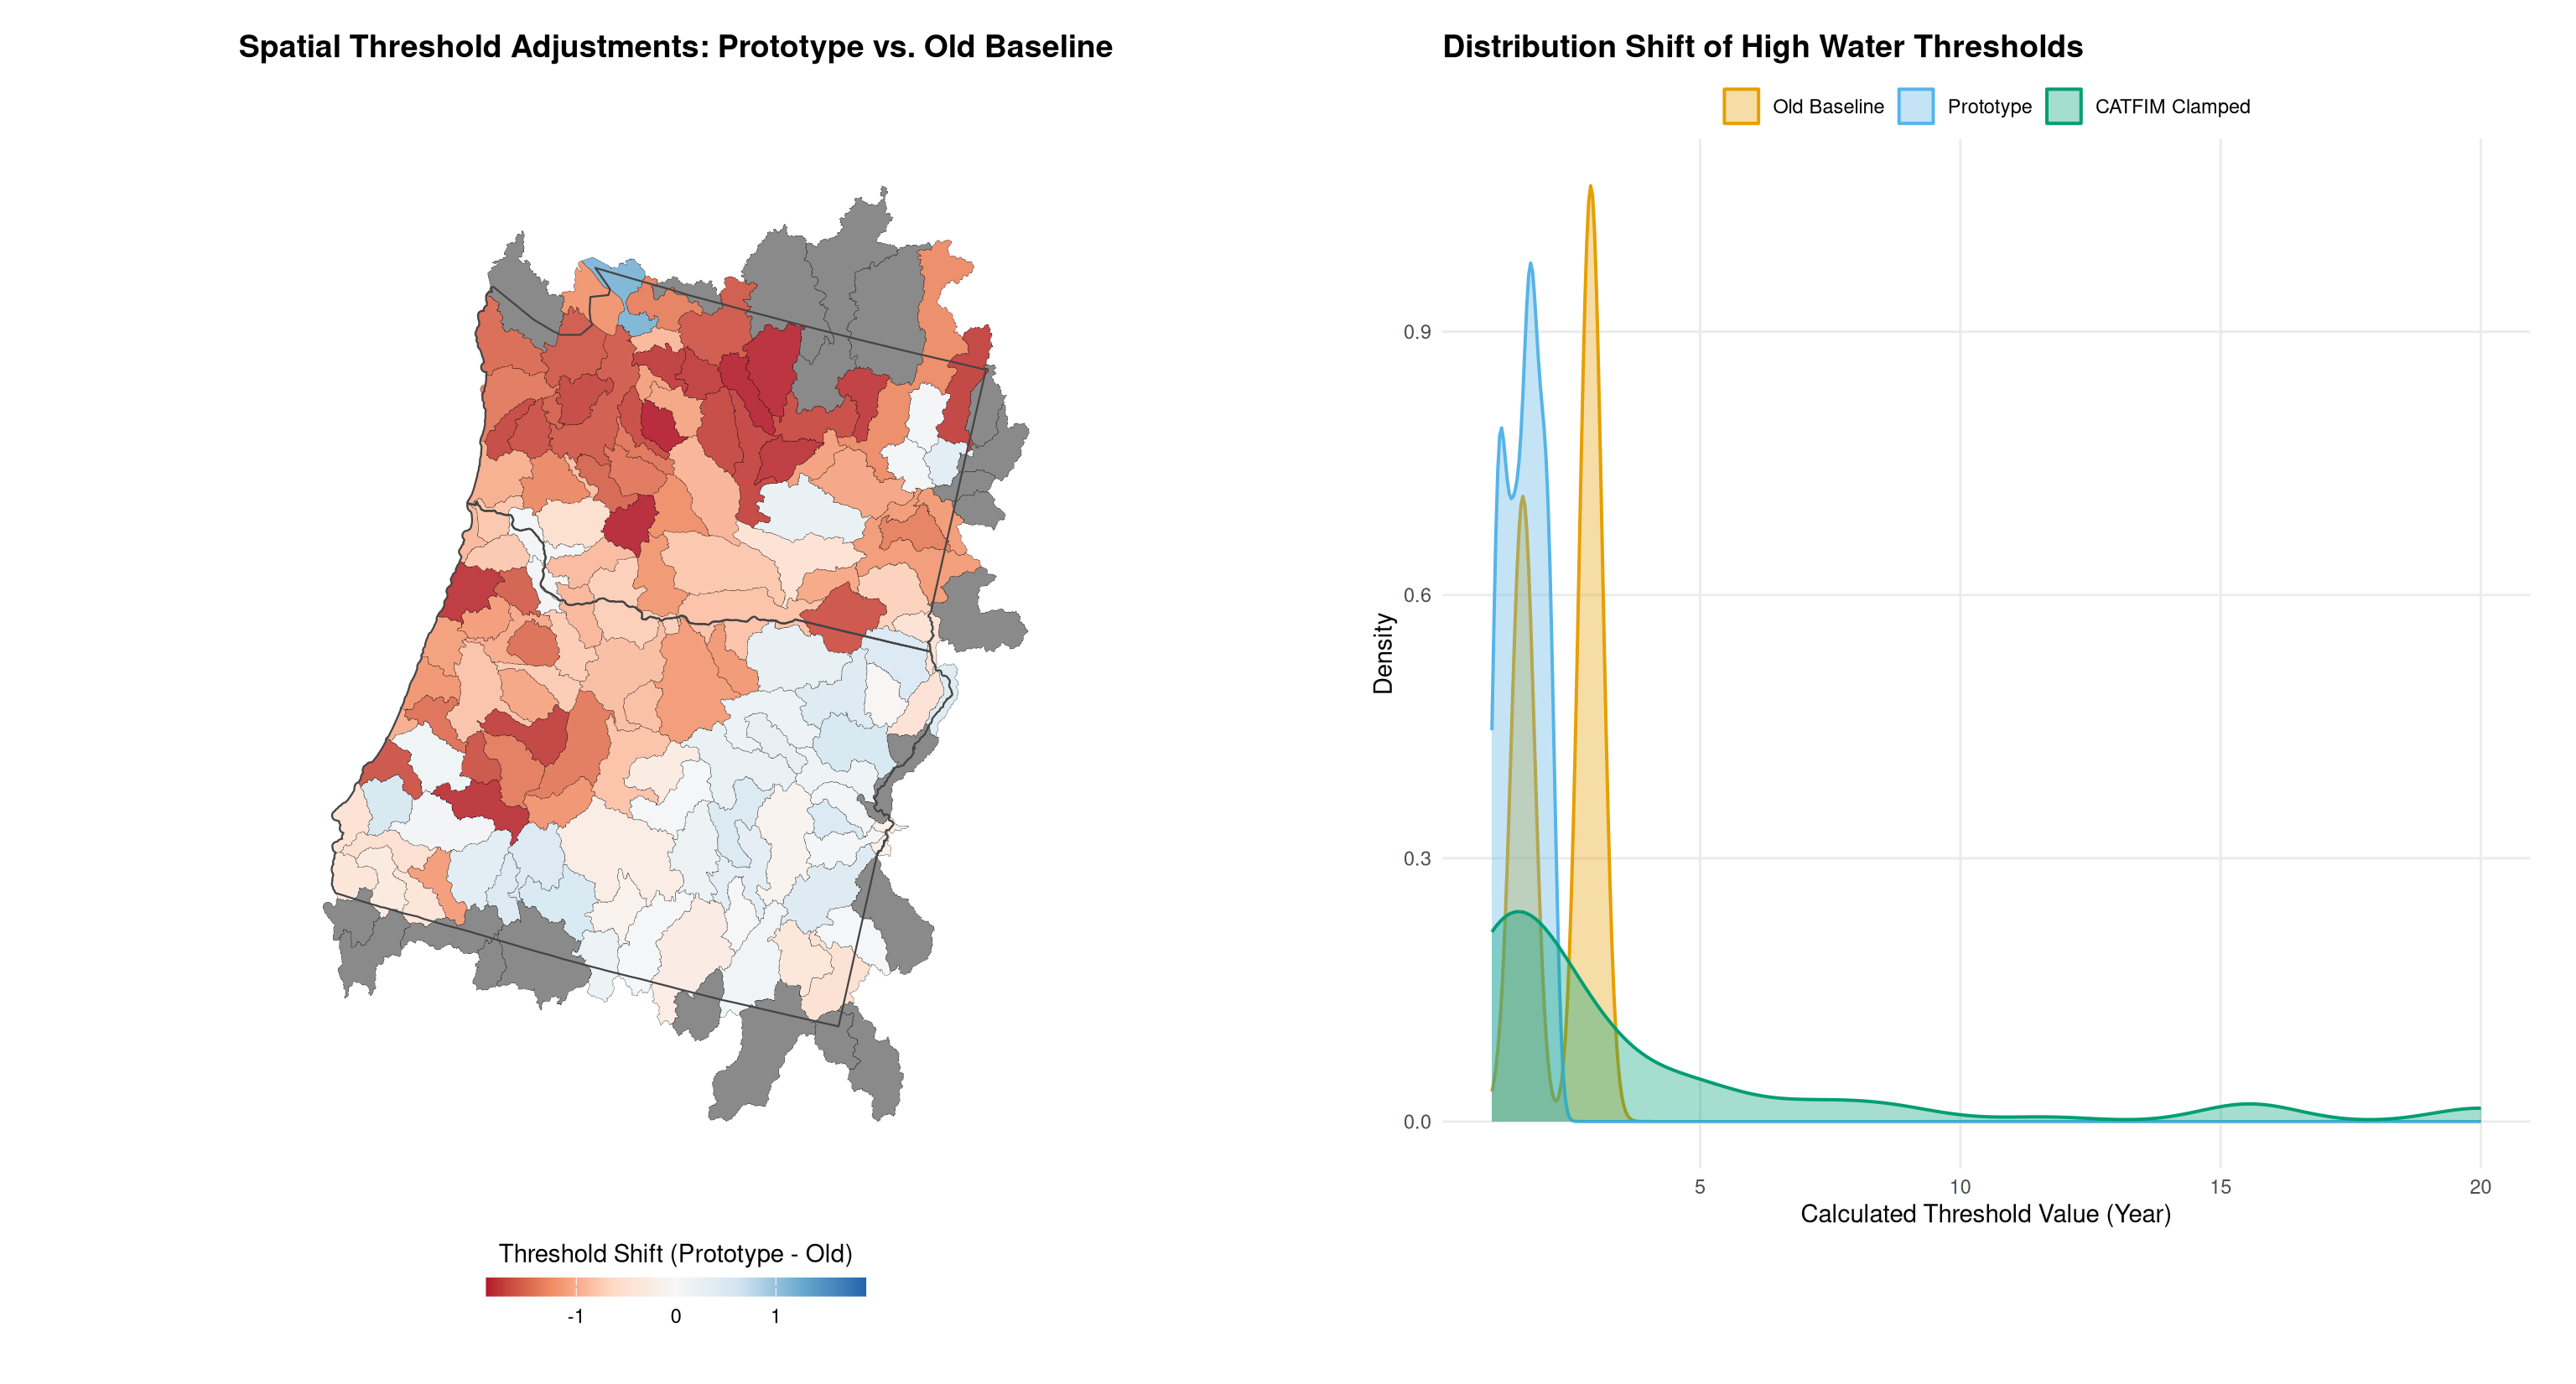
Describing changes
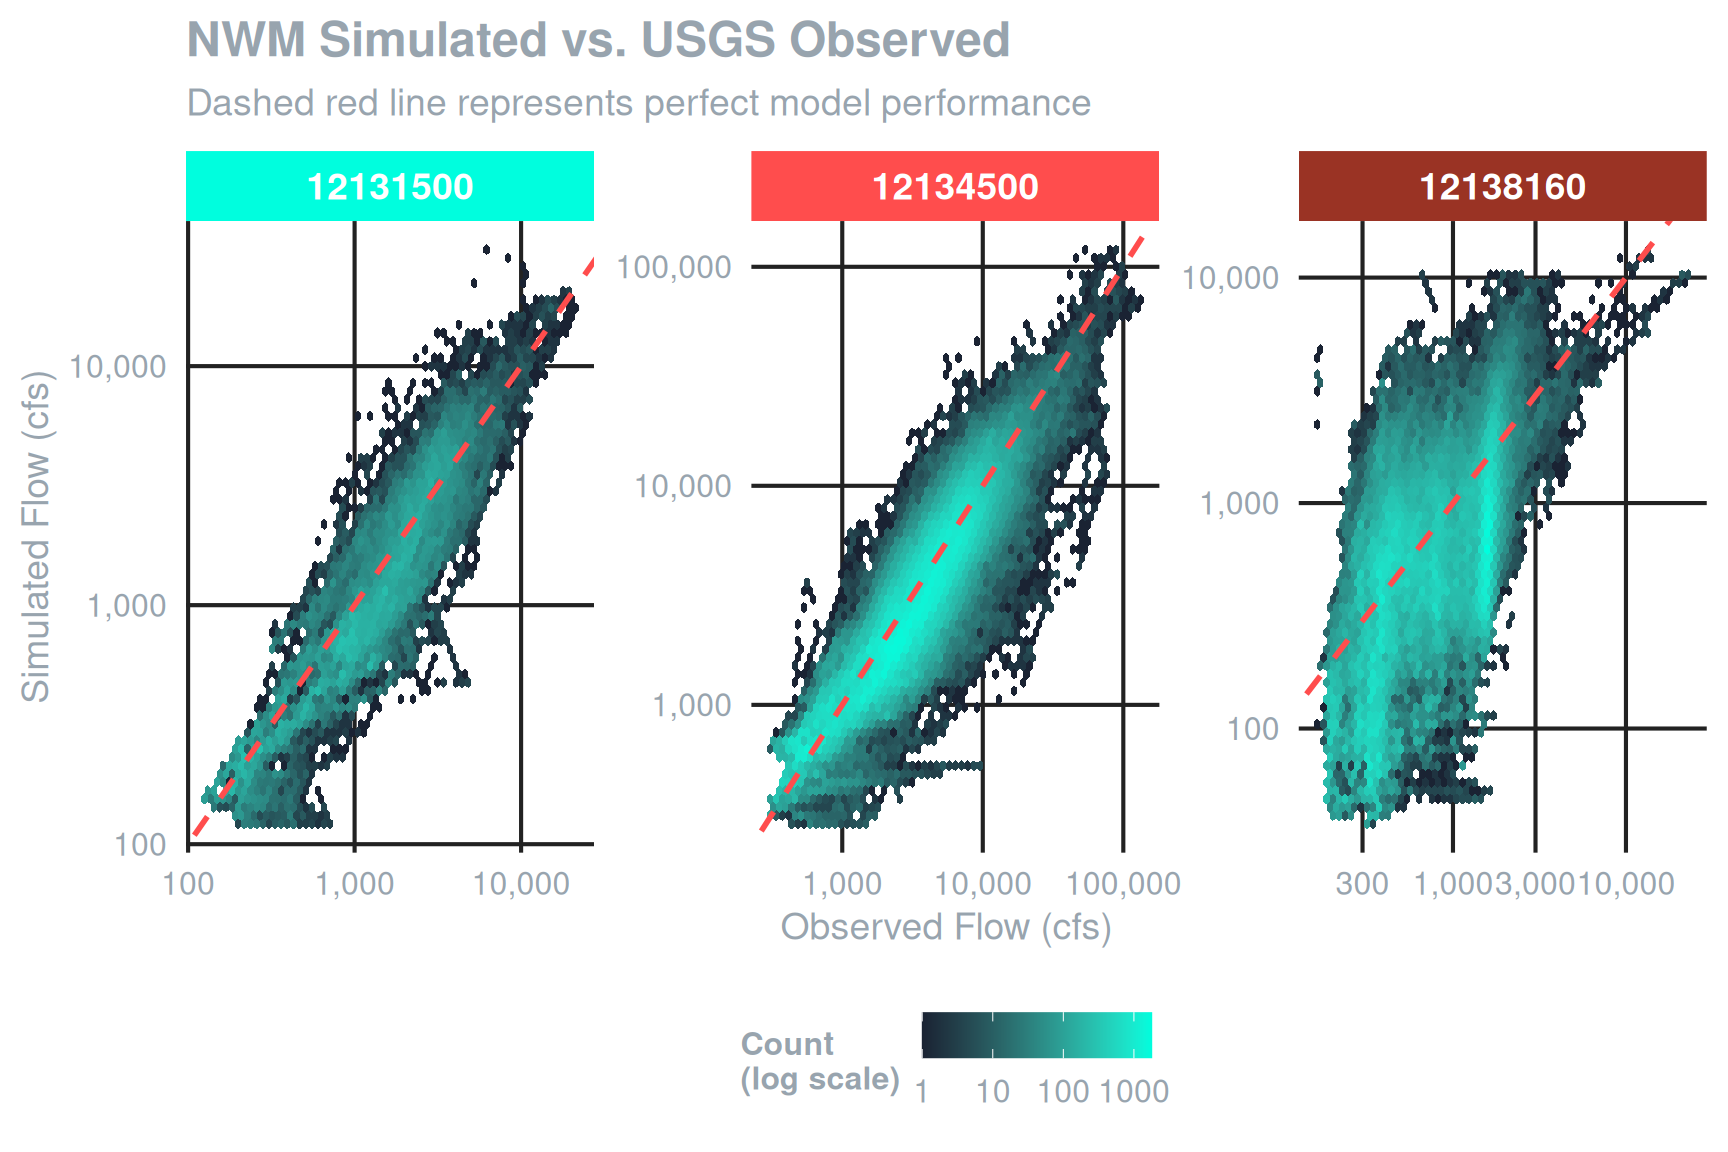
Statistical Variations & Visual Trends
| Site ID | Flowpath ID | Hours (N) | NSE | PBIAS (%) | r |
|---|---|---|---|---|---|
| 12131500 | 23963211 | 51,876 | 0.68 | −5.0 | 0.87 |
| 12134500 | 23963021 | 303,979 | 0.73 | −9.9 | 0.86 |
| 12138160 | 23963701 | 271,012 | −0.17 | −18.7 | 0.55 |
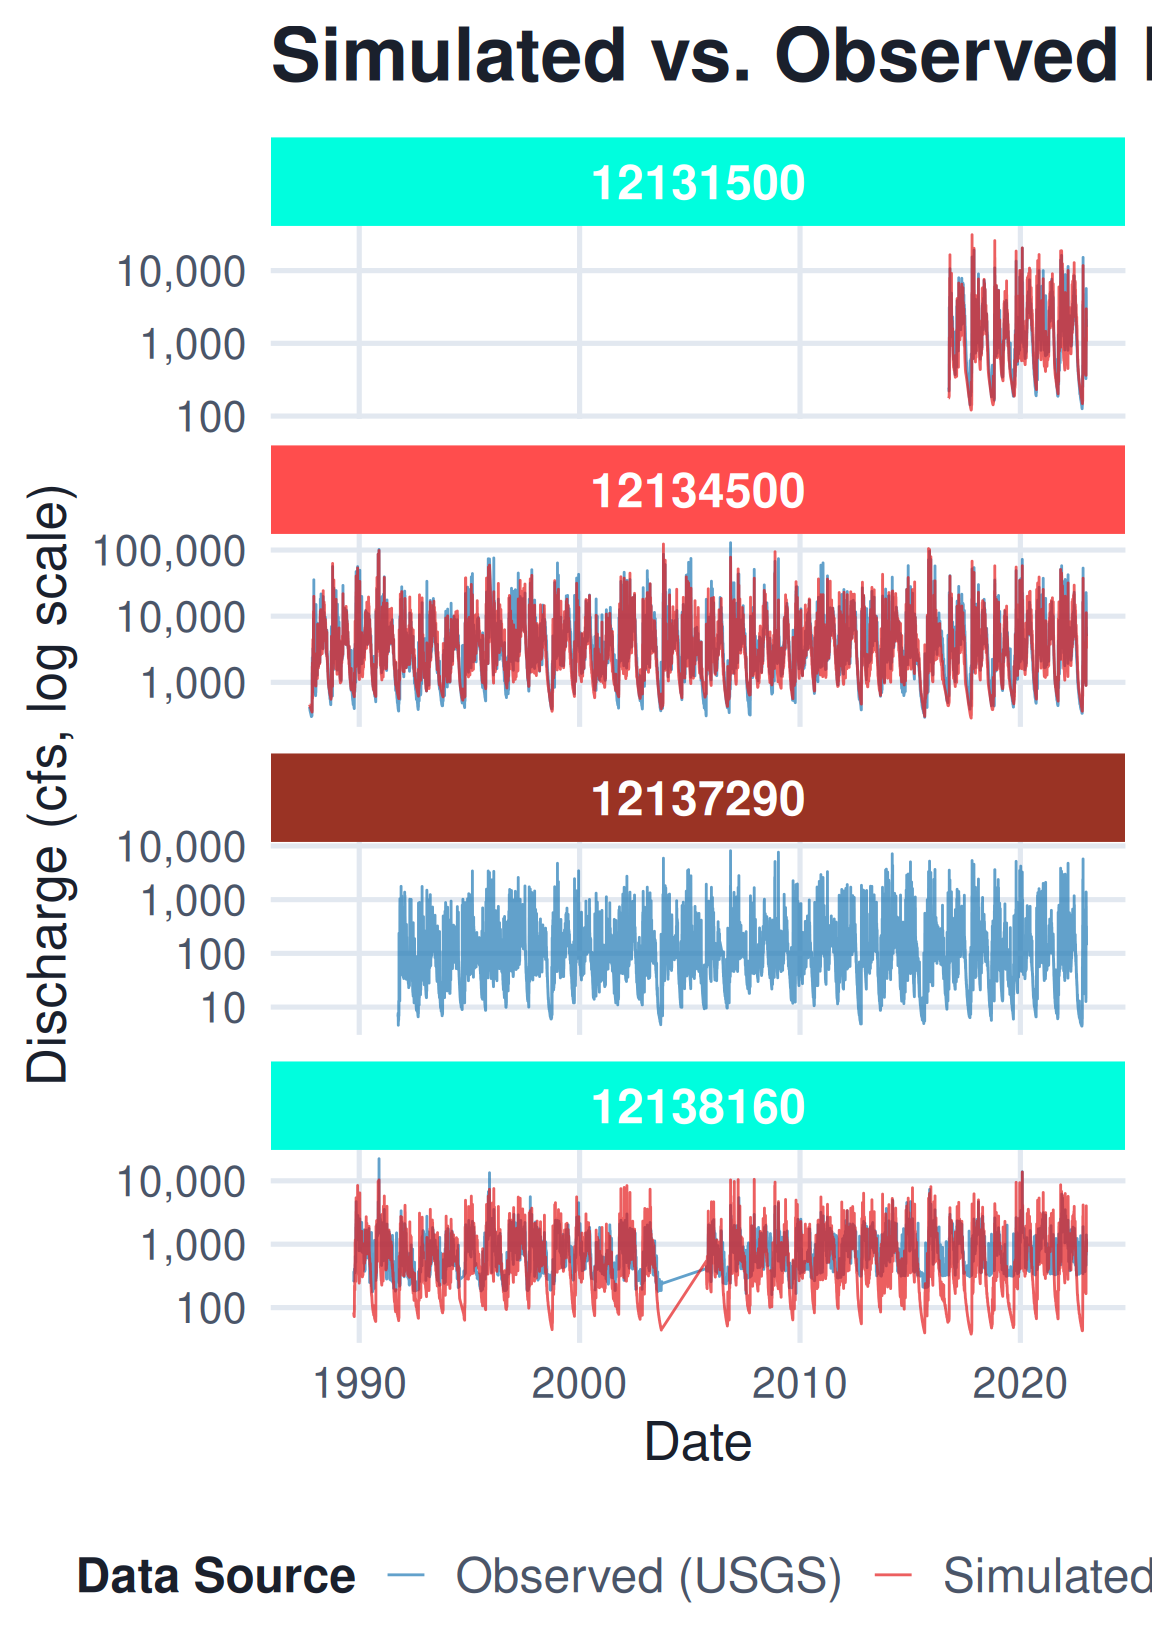
Gage Spesific Behavior
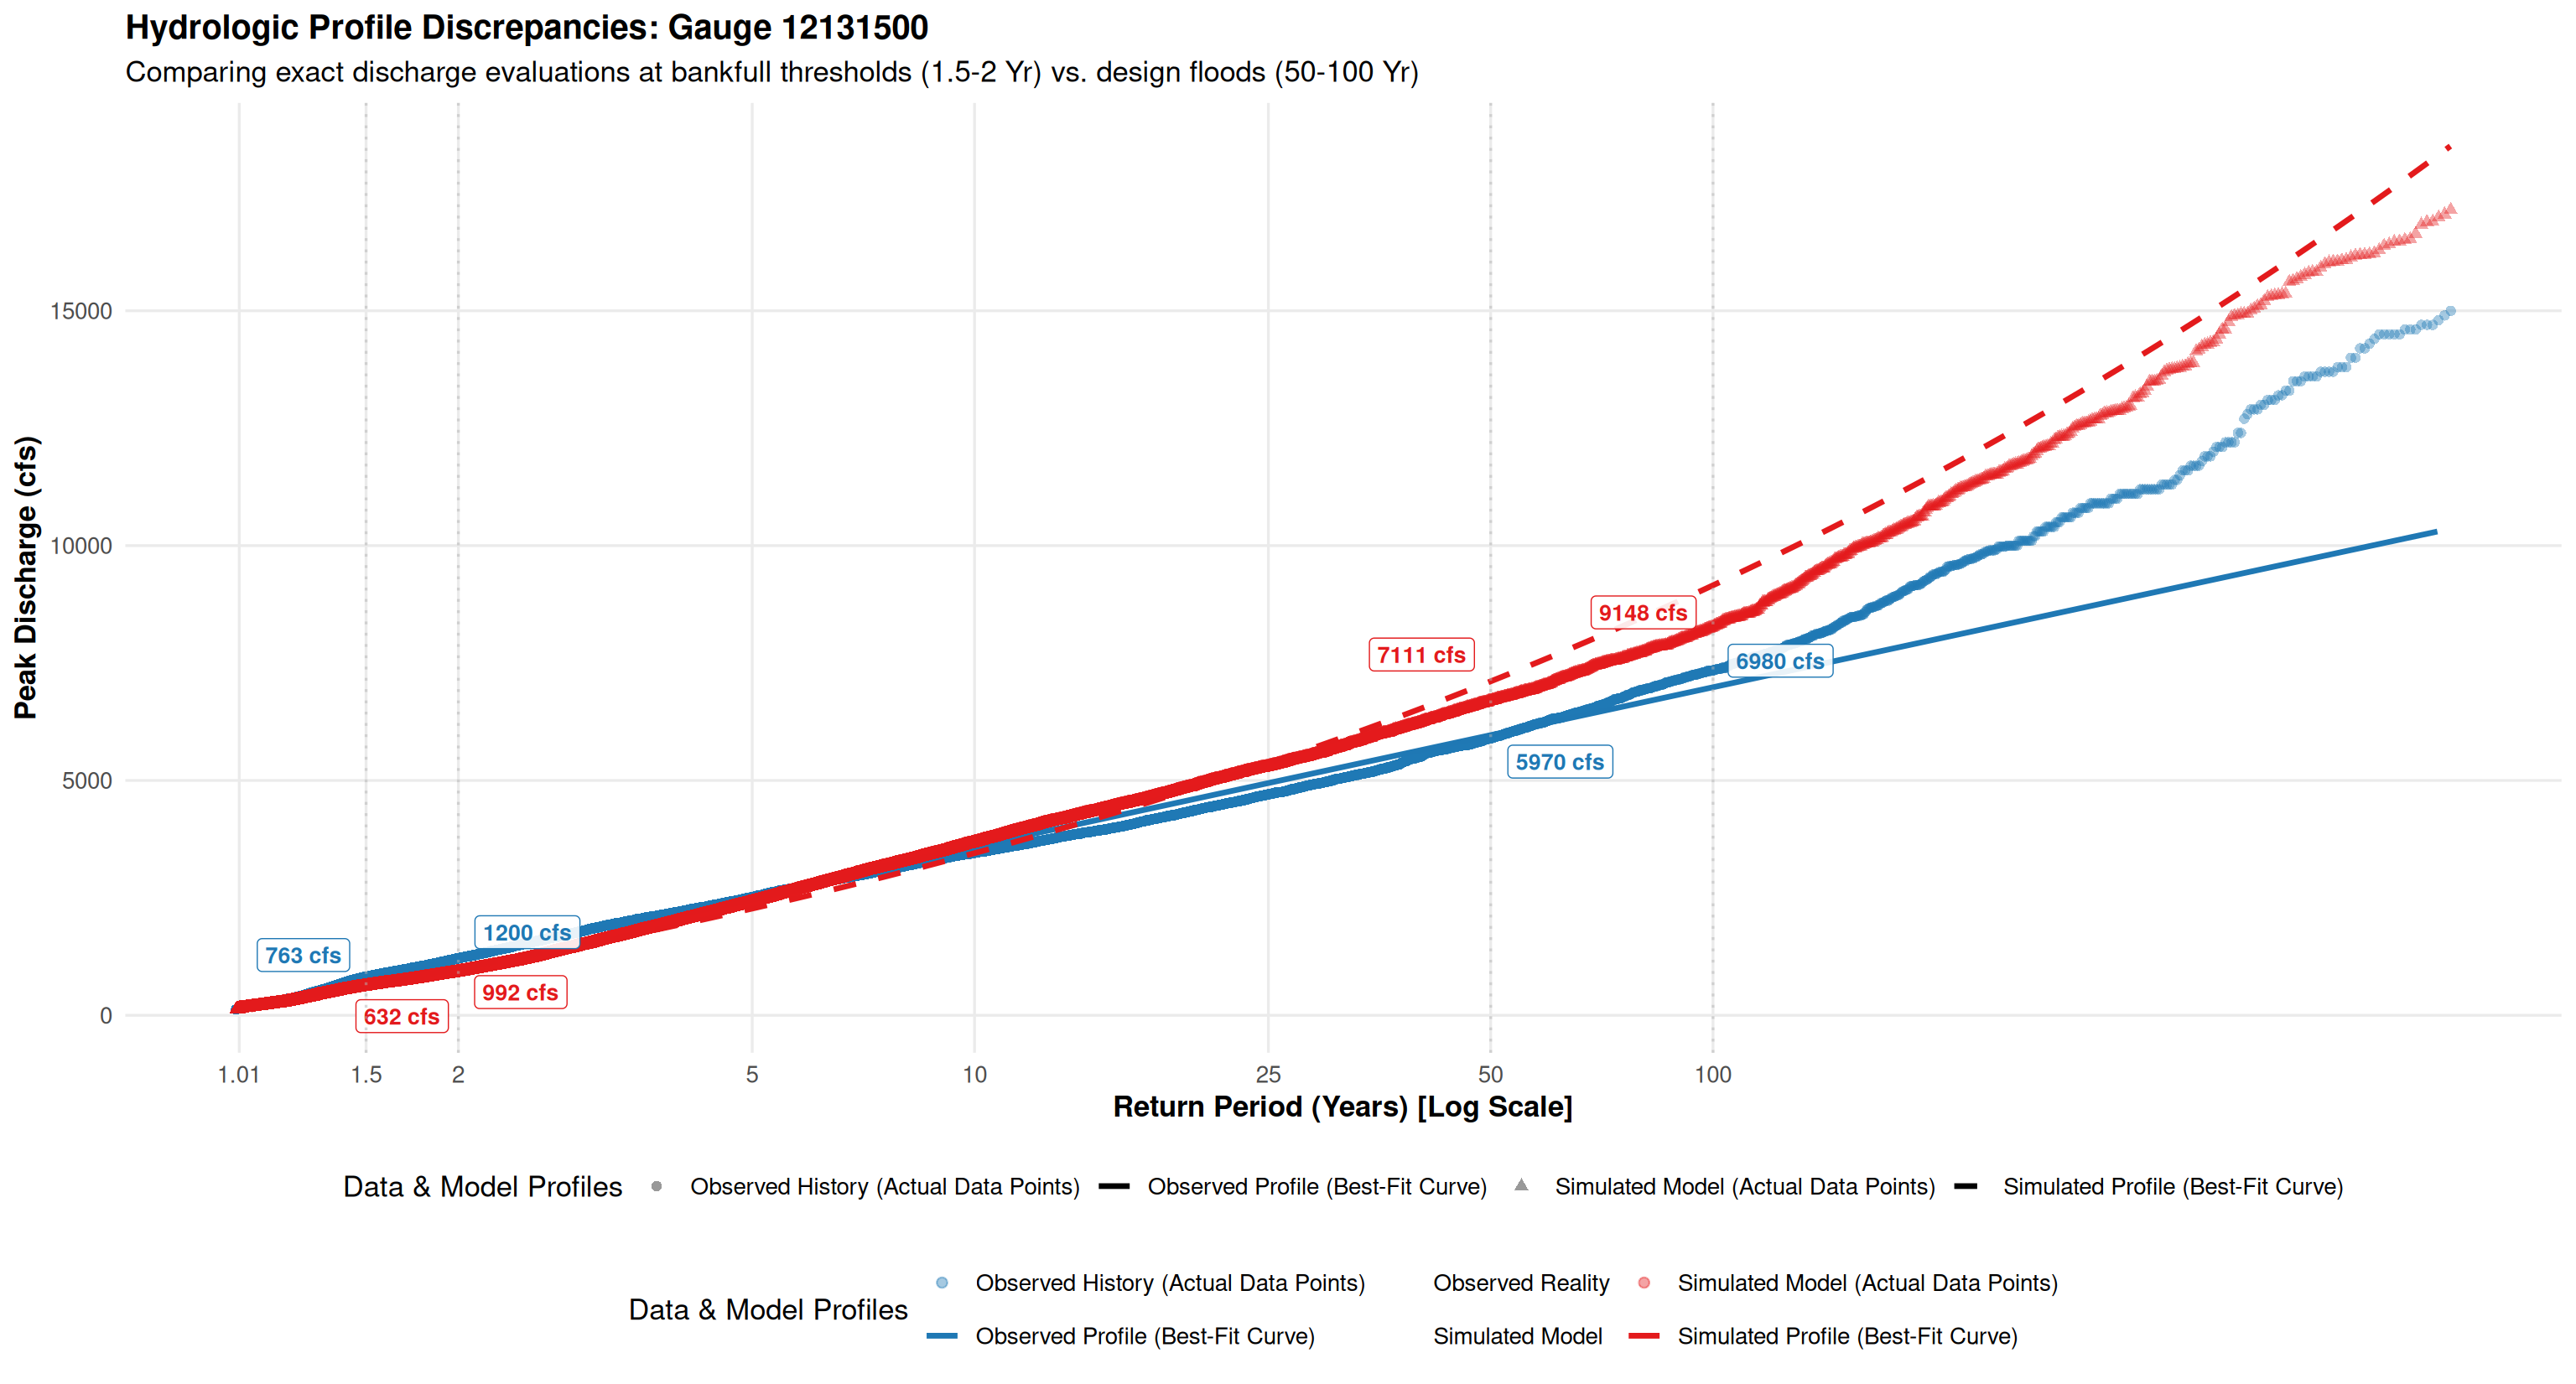
Regional breakdown: (over the shared domain)
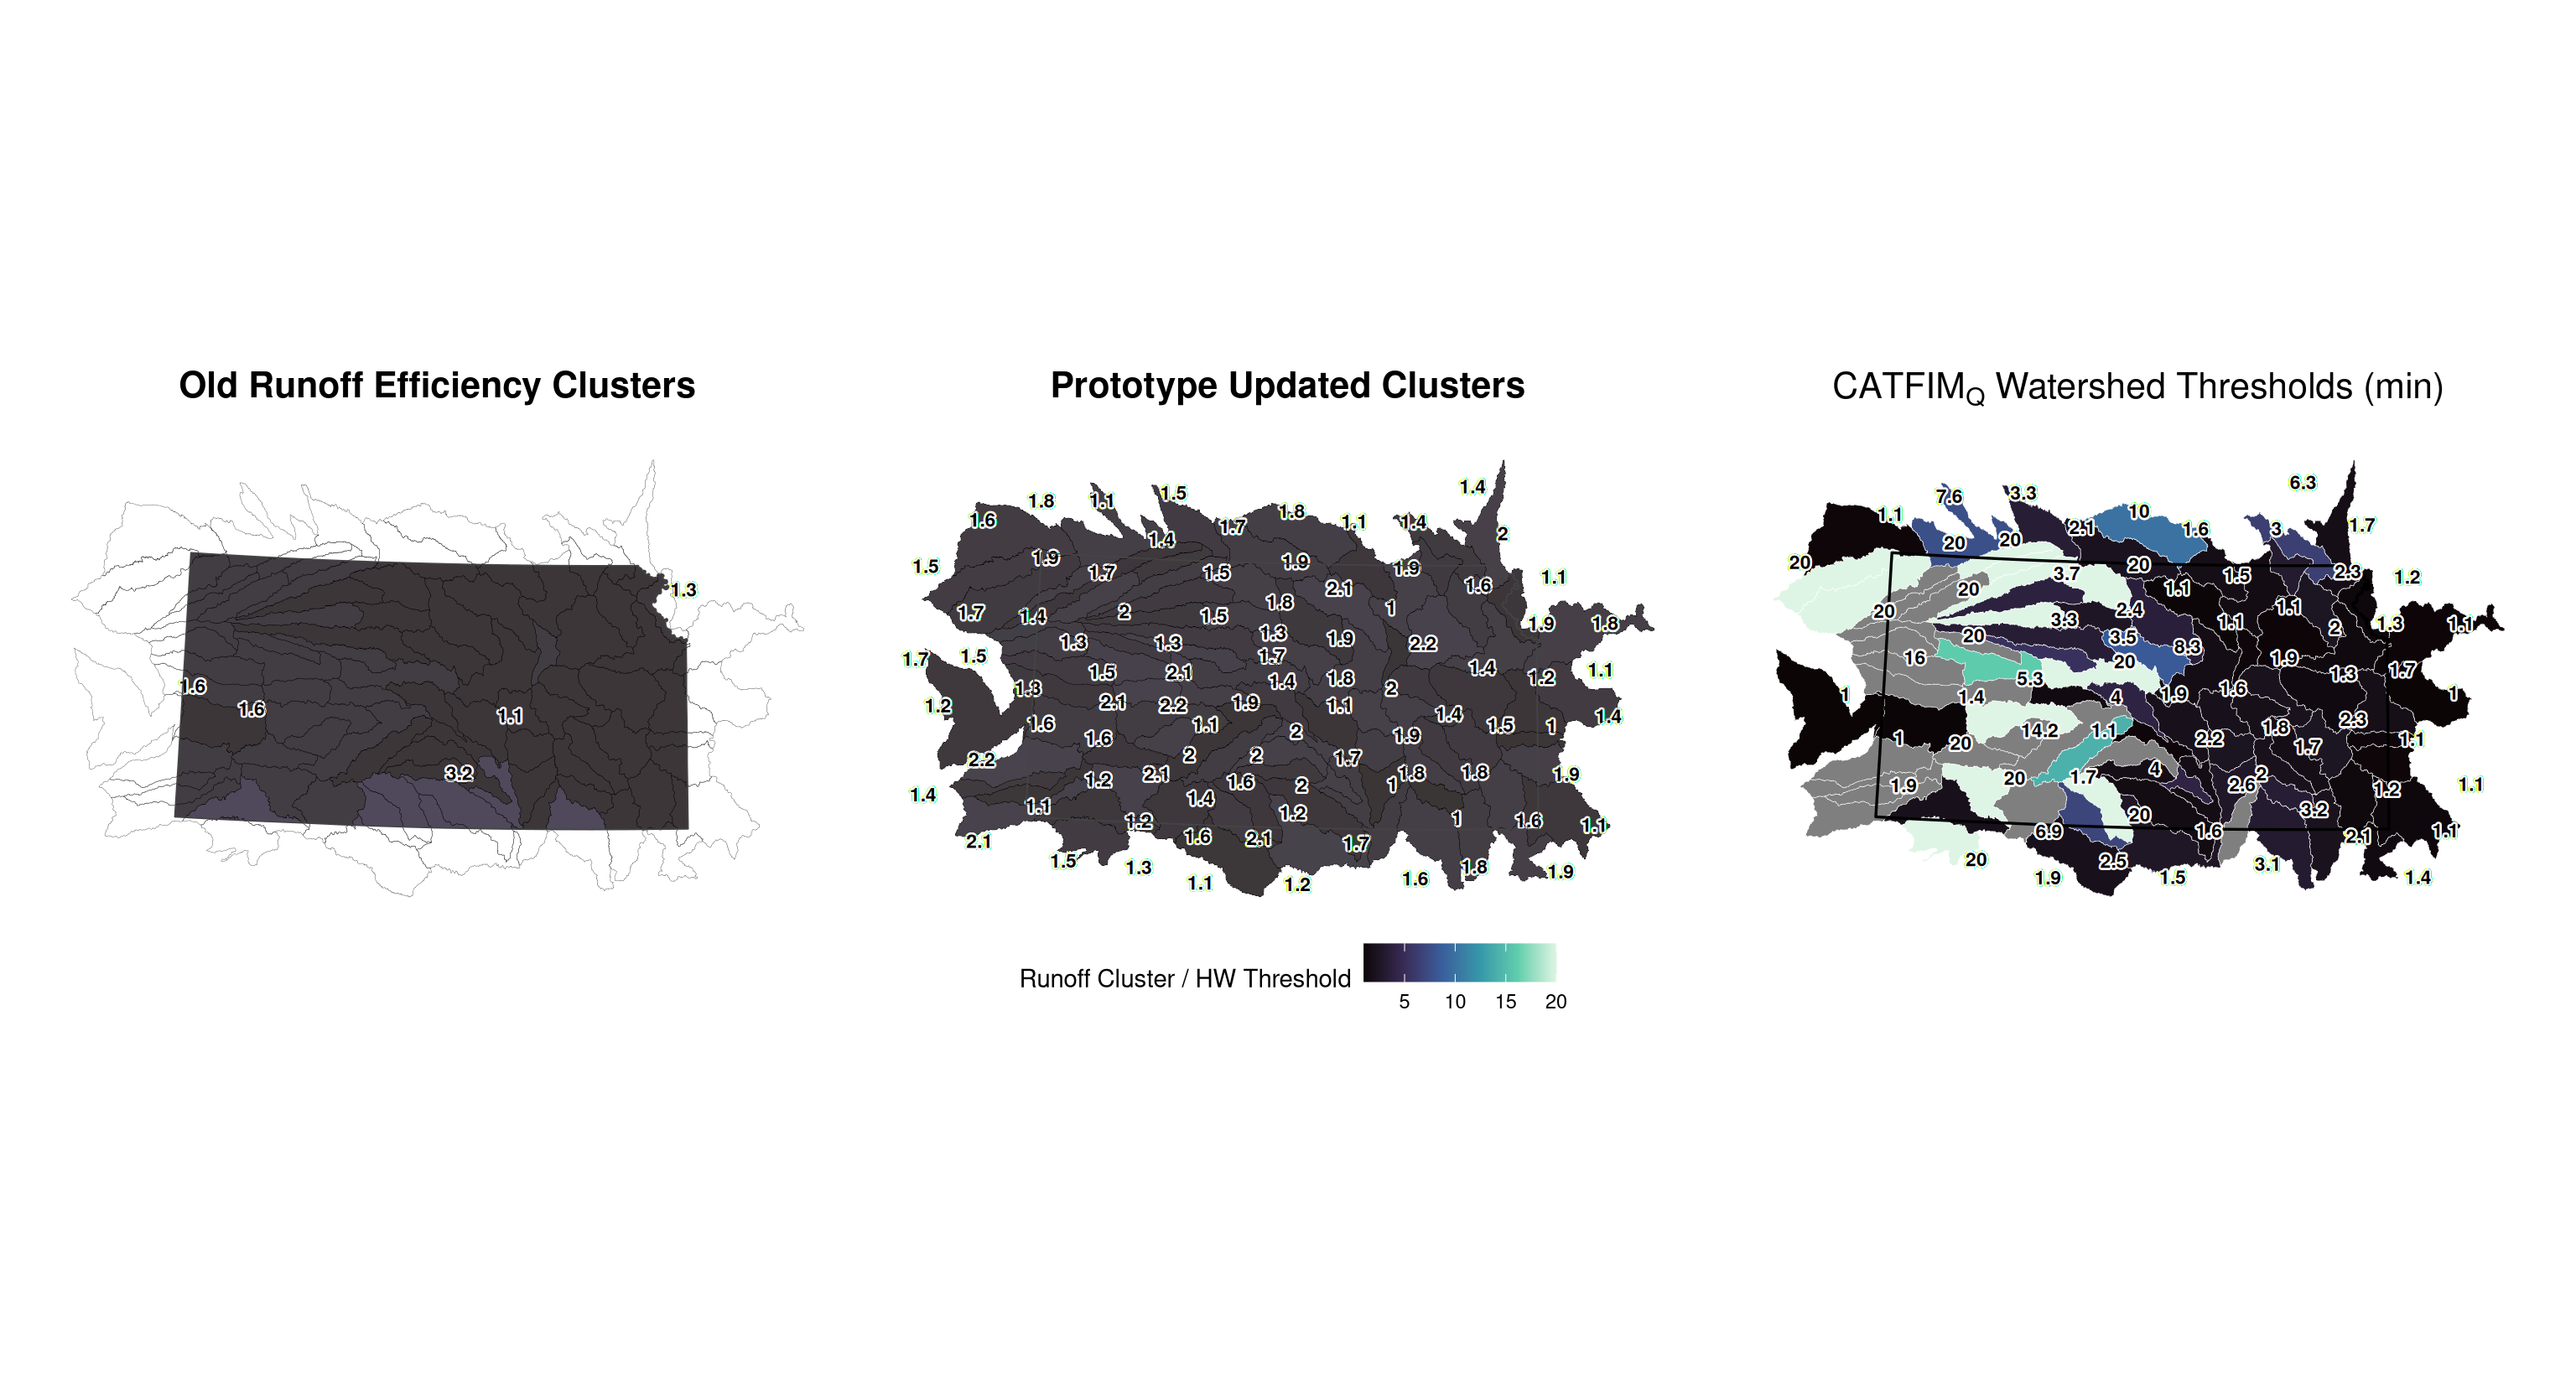
Regional breakdown: (in the only state that exists :) )
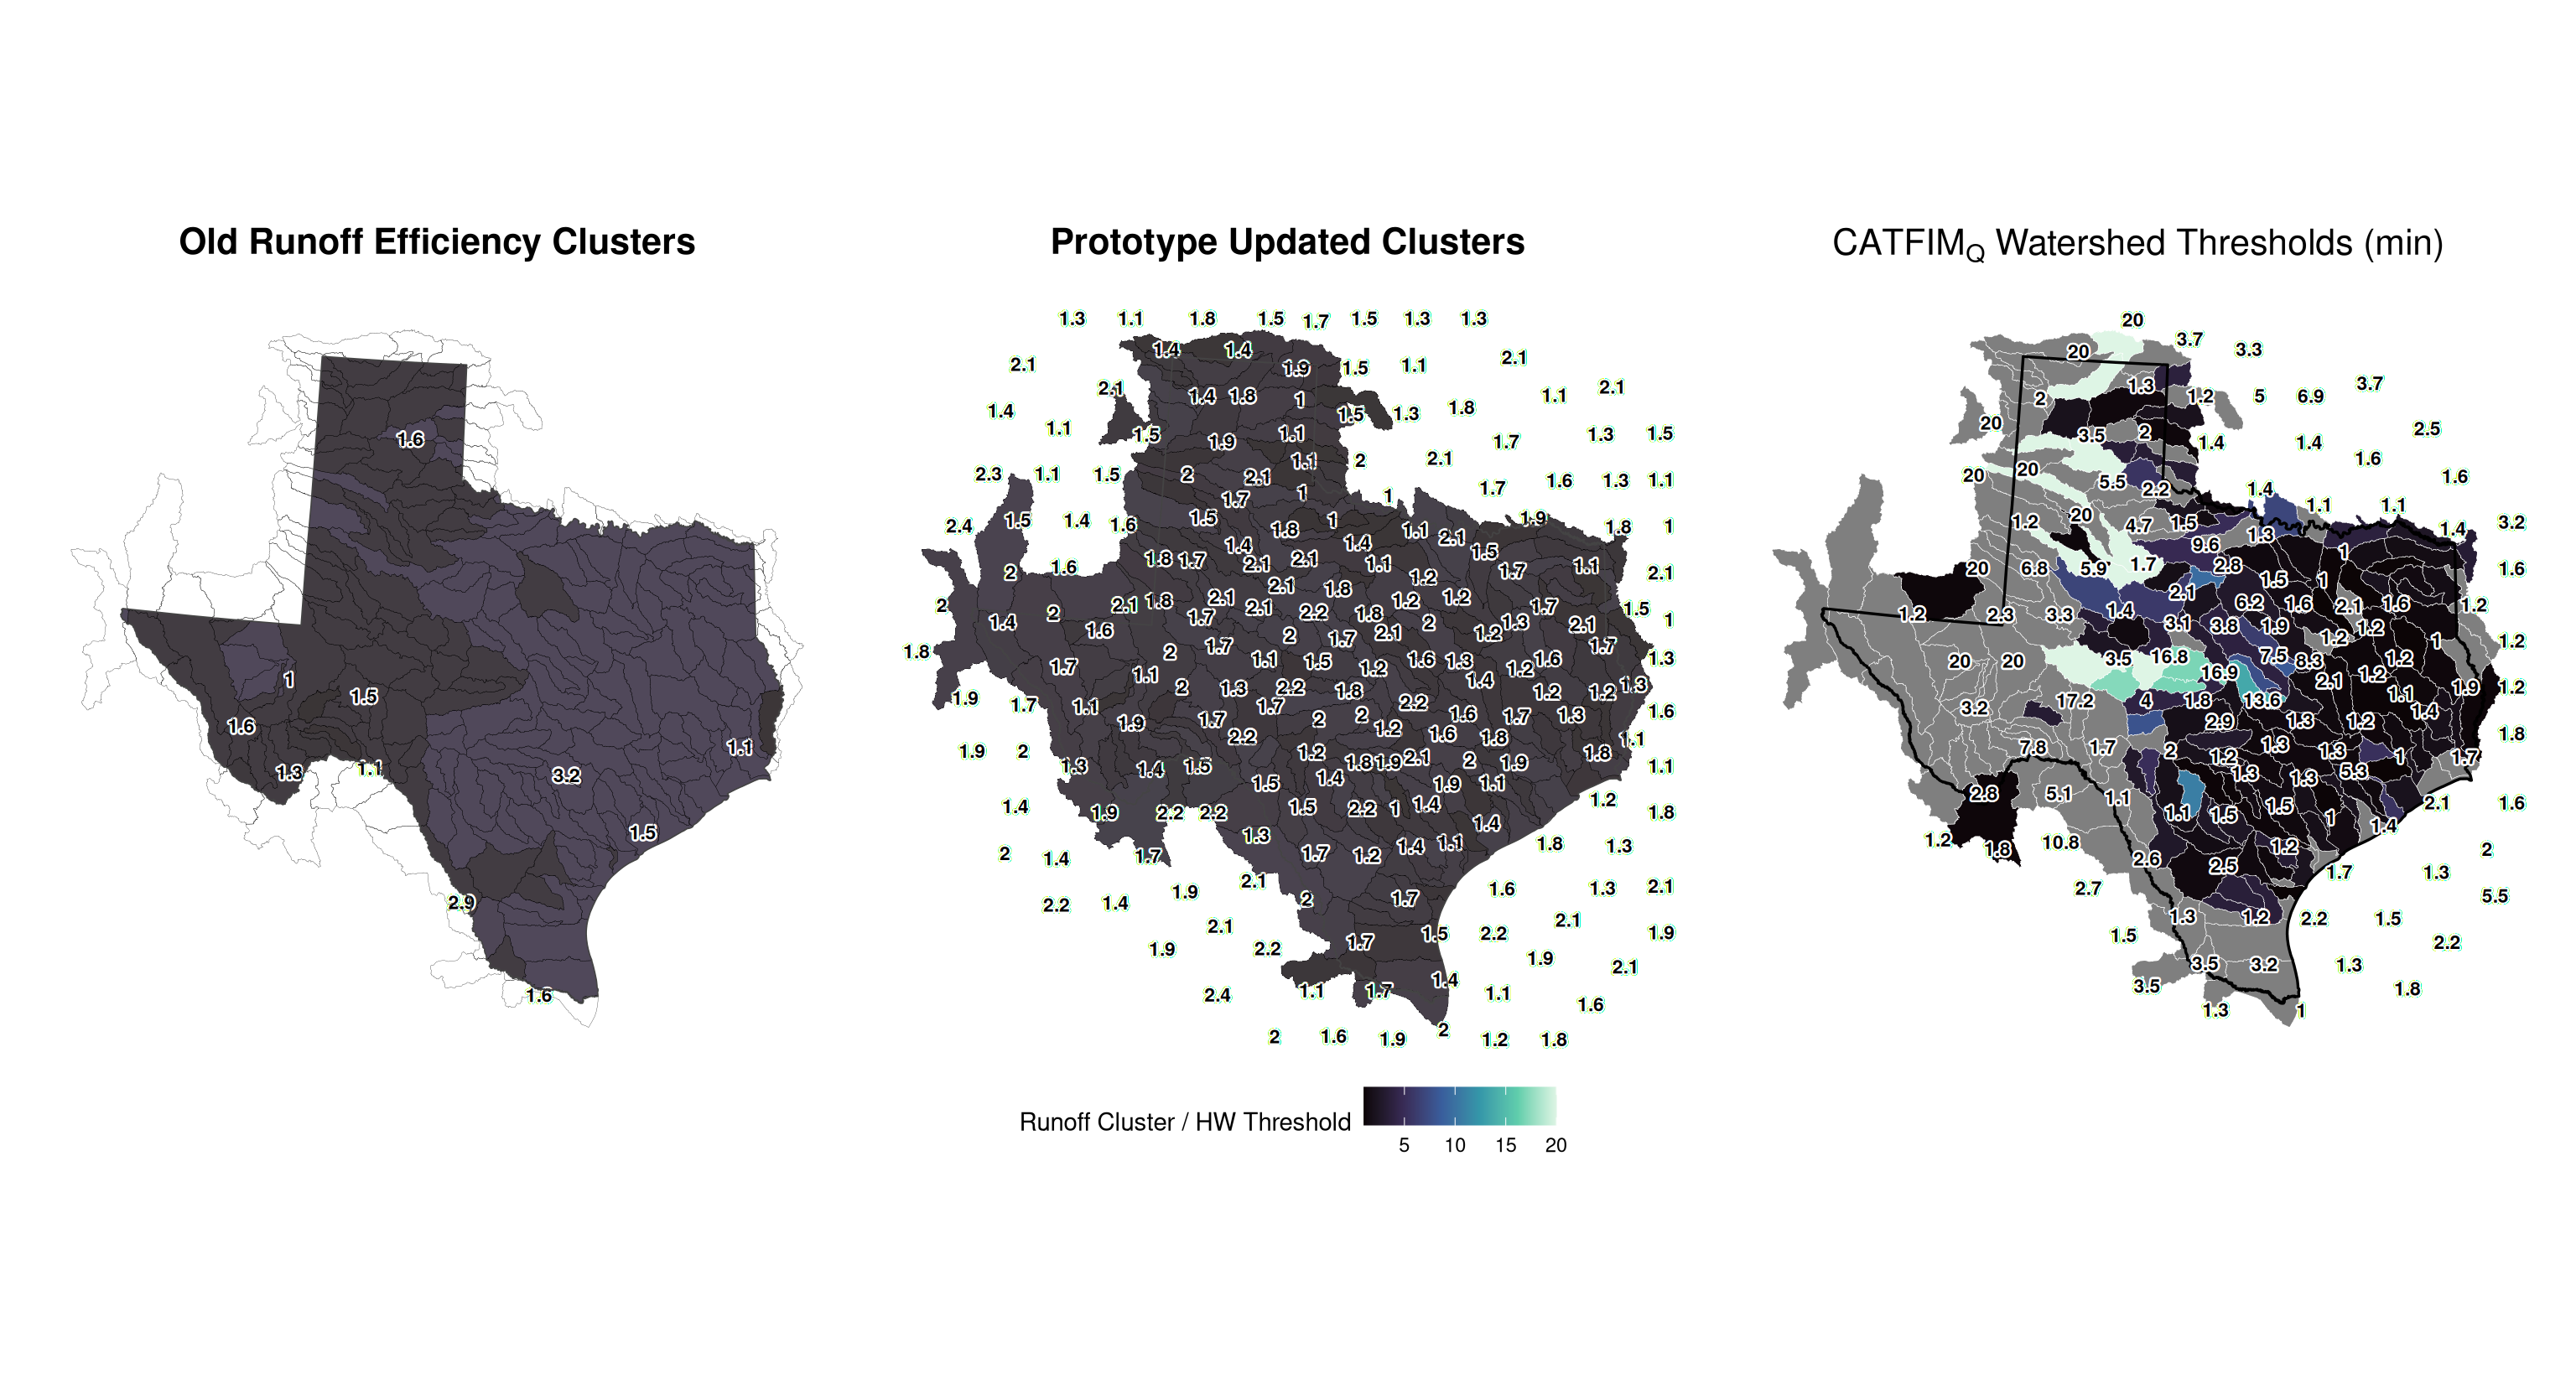
Regional breakdown: (the thrid hottest state in the union)
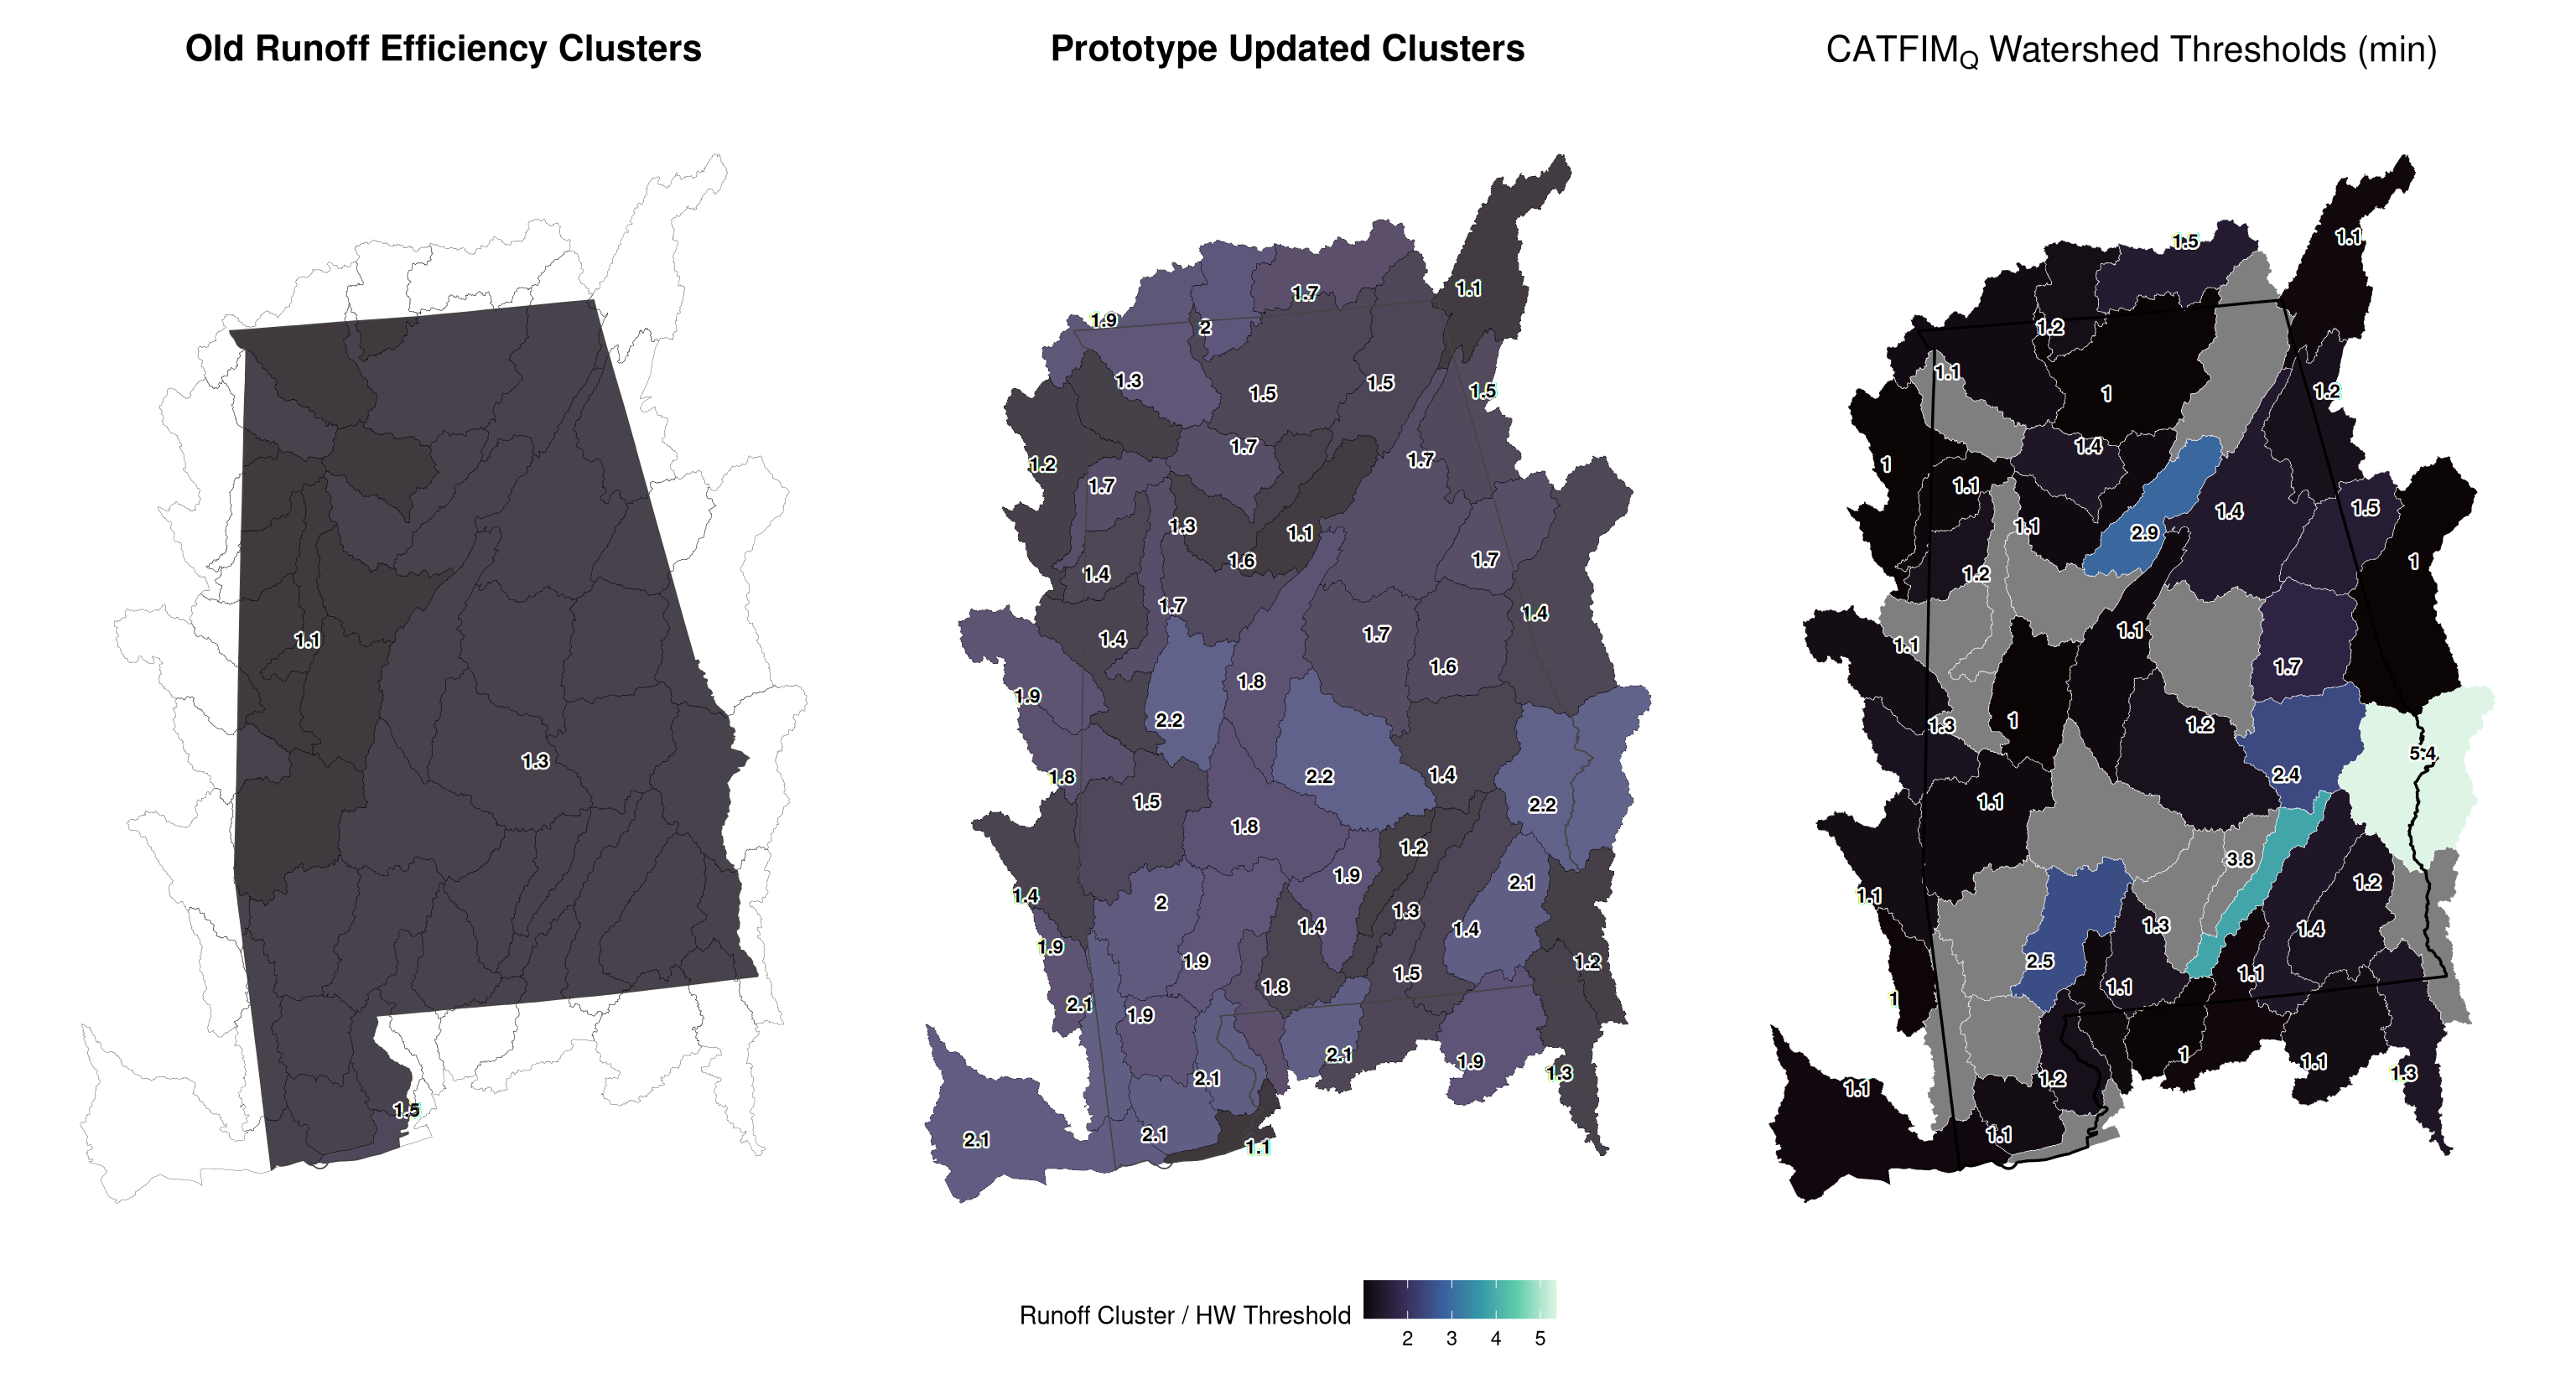
A “Gut check” assessment
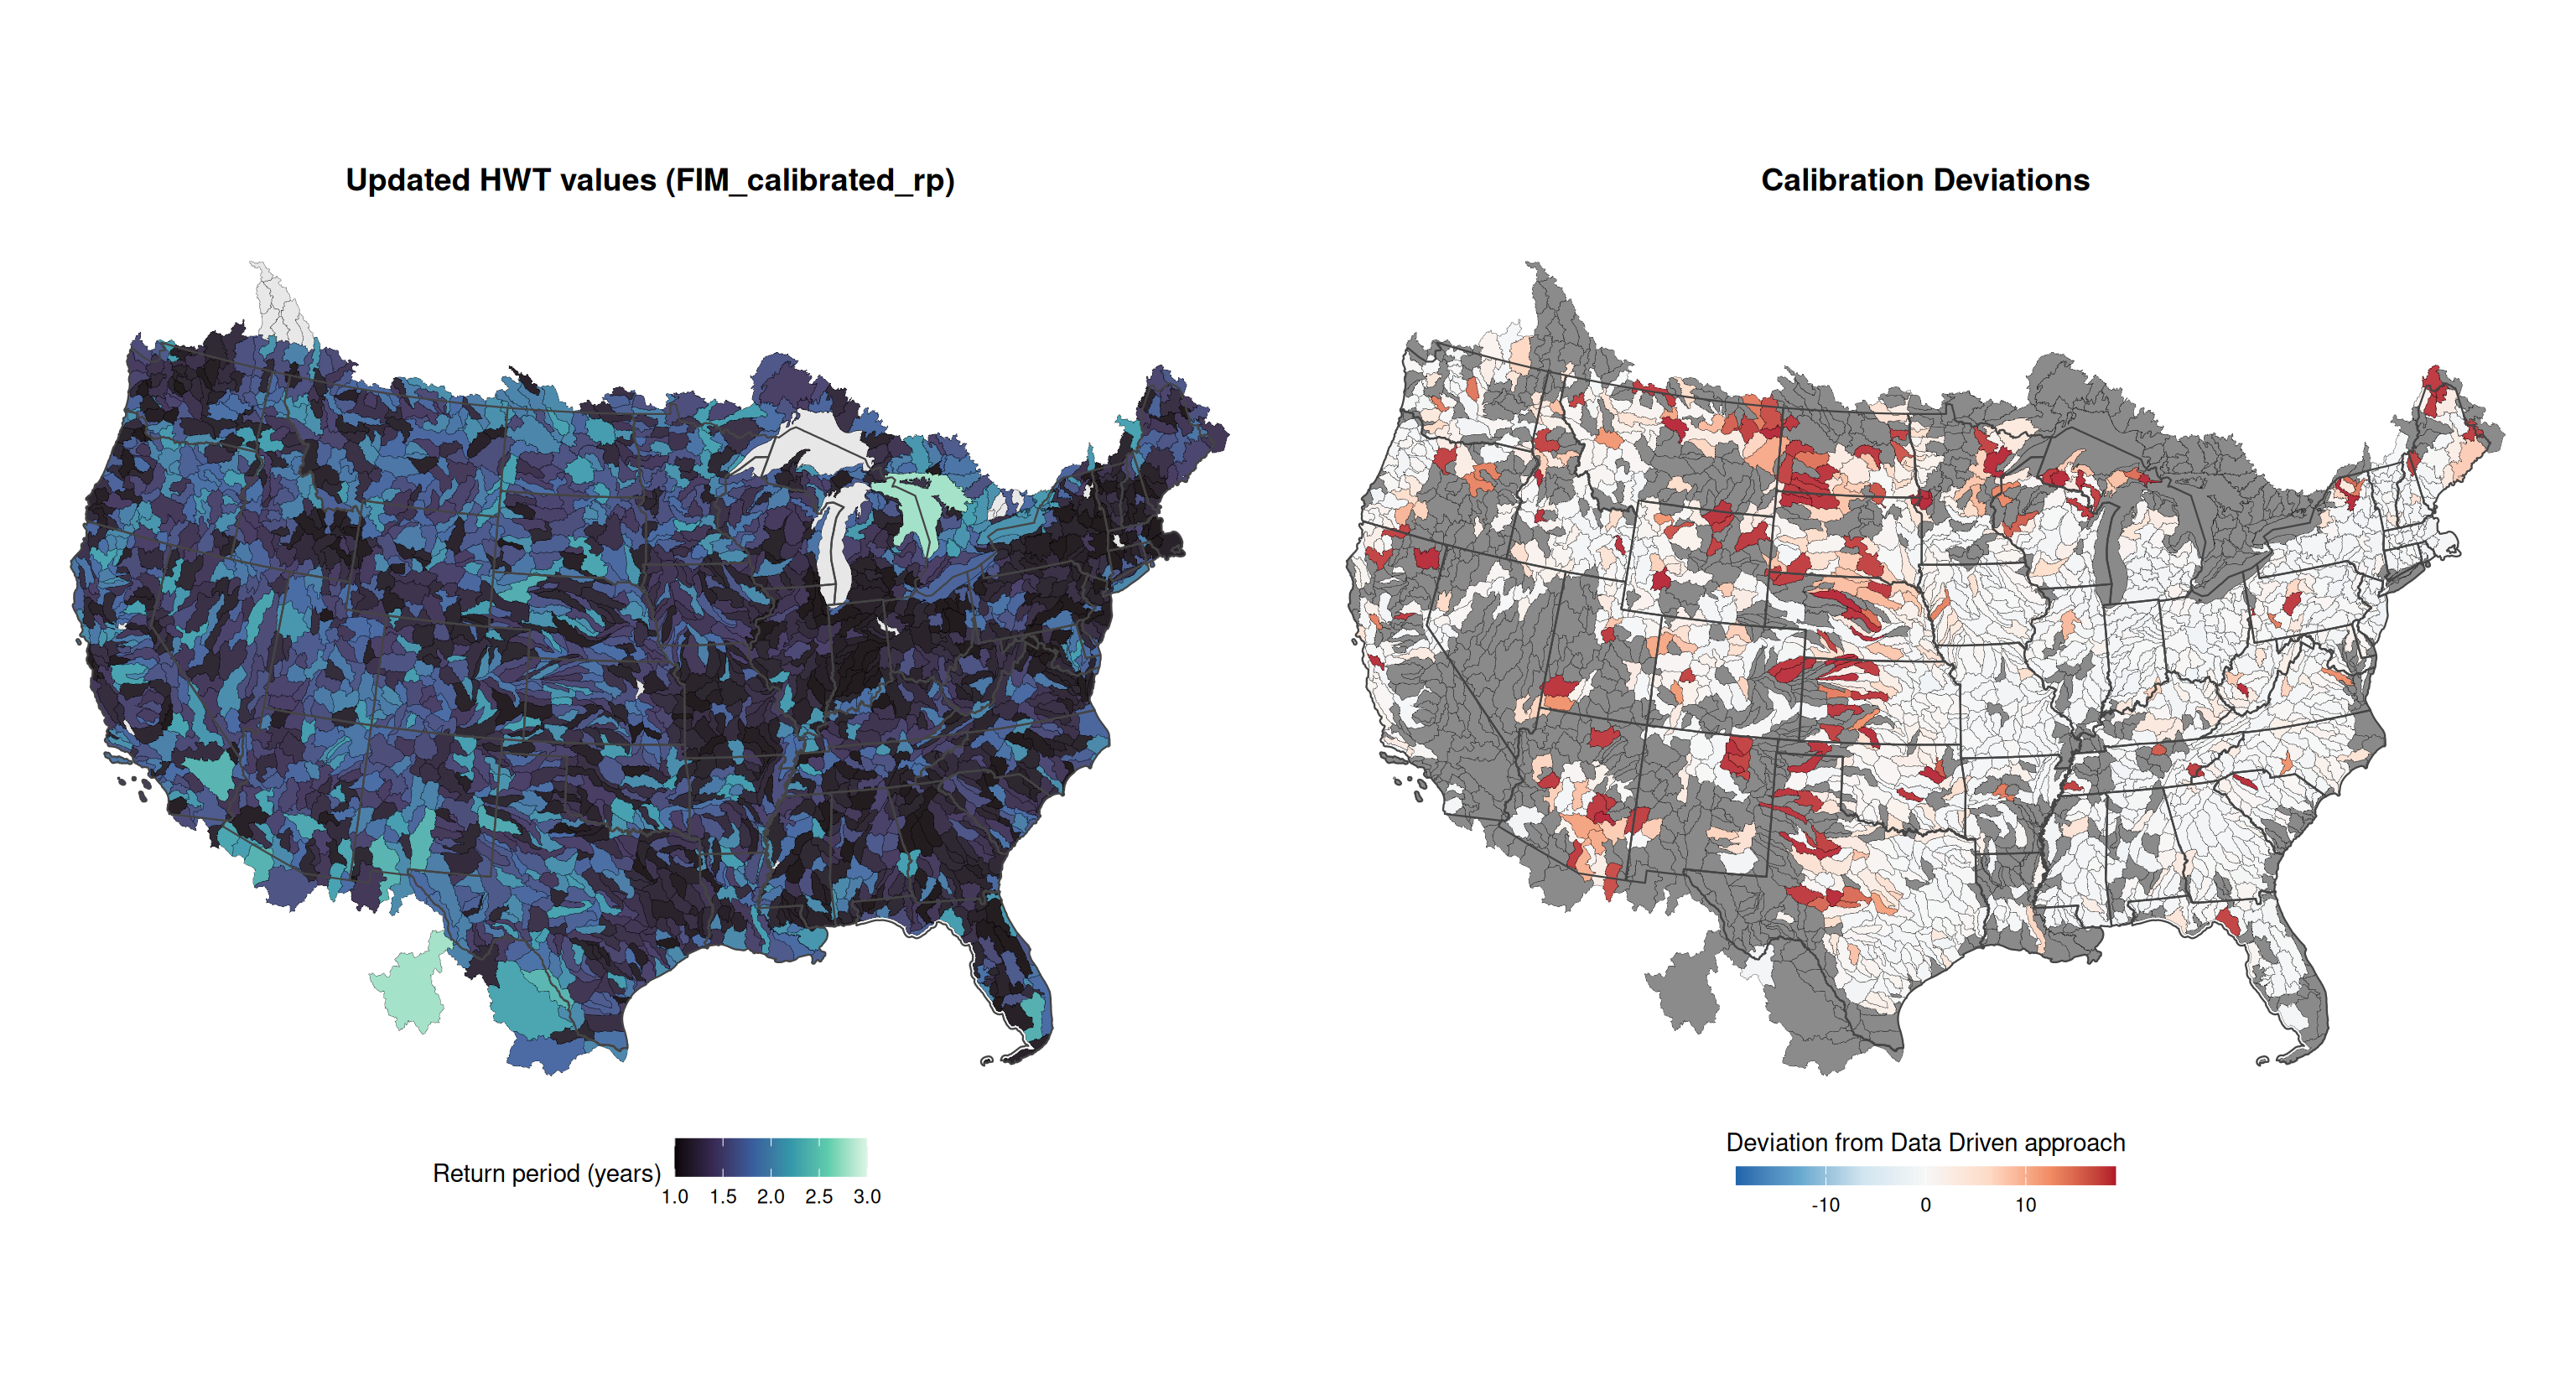
What’s Next?
Outcomes and Takeaways:
- It seems that in the Pacific northwest at least, the distributions of discharge predicted by the National Water Model (v3) do not match the desired benchlines.
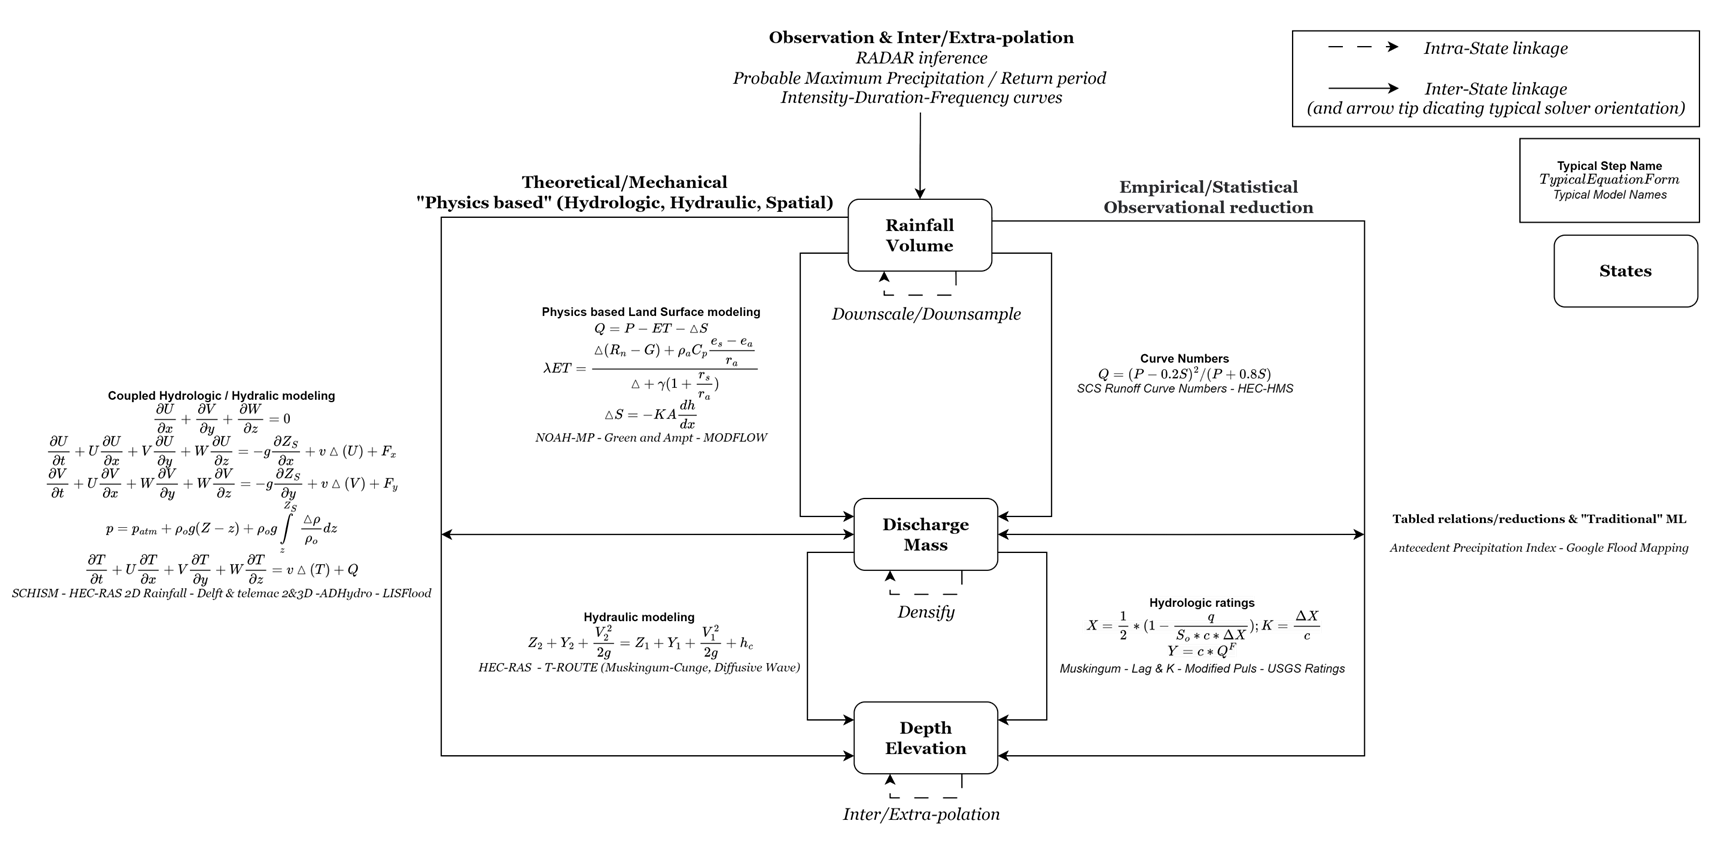
- This is a wicked system; CATFIMQ is a poor separation of concerns relative to the RFC/WFO perspective - use case - FIM access pattern?
Next Steps:
-
- More CATFIMWSE
Sources:
