Review: Variability and Trends in Runoff Efficiency in the Conterminous United States
Reviewing: Variability and Trends in Runoff Efficiency in the Conterminous United States
Goals:
- Prove I can read.
Outcomes and Takeaways:
- A shared understanding of the methods and efforts our giants have provided.
- A better appreciation of how this effort leaned on previous efforts.
McCabe and Wolock (2016)
Methods
Question:
- evaluate temporal variability and trends in RE across the CONUS
- identify climatic and/or water-use factors driving changes in RE.
Methods:
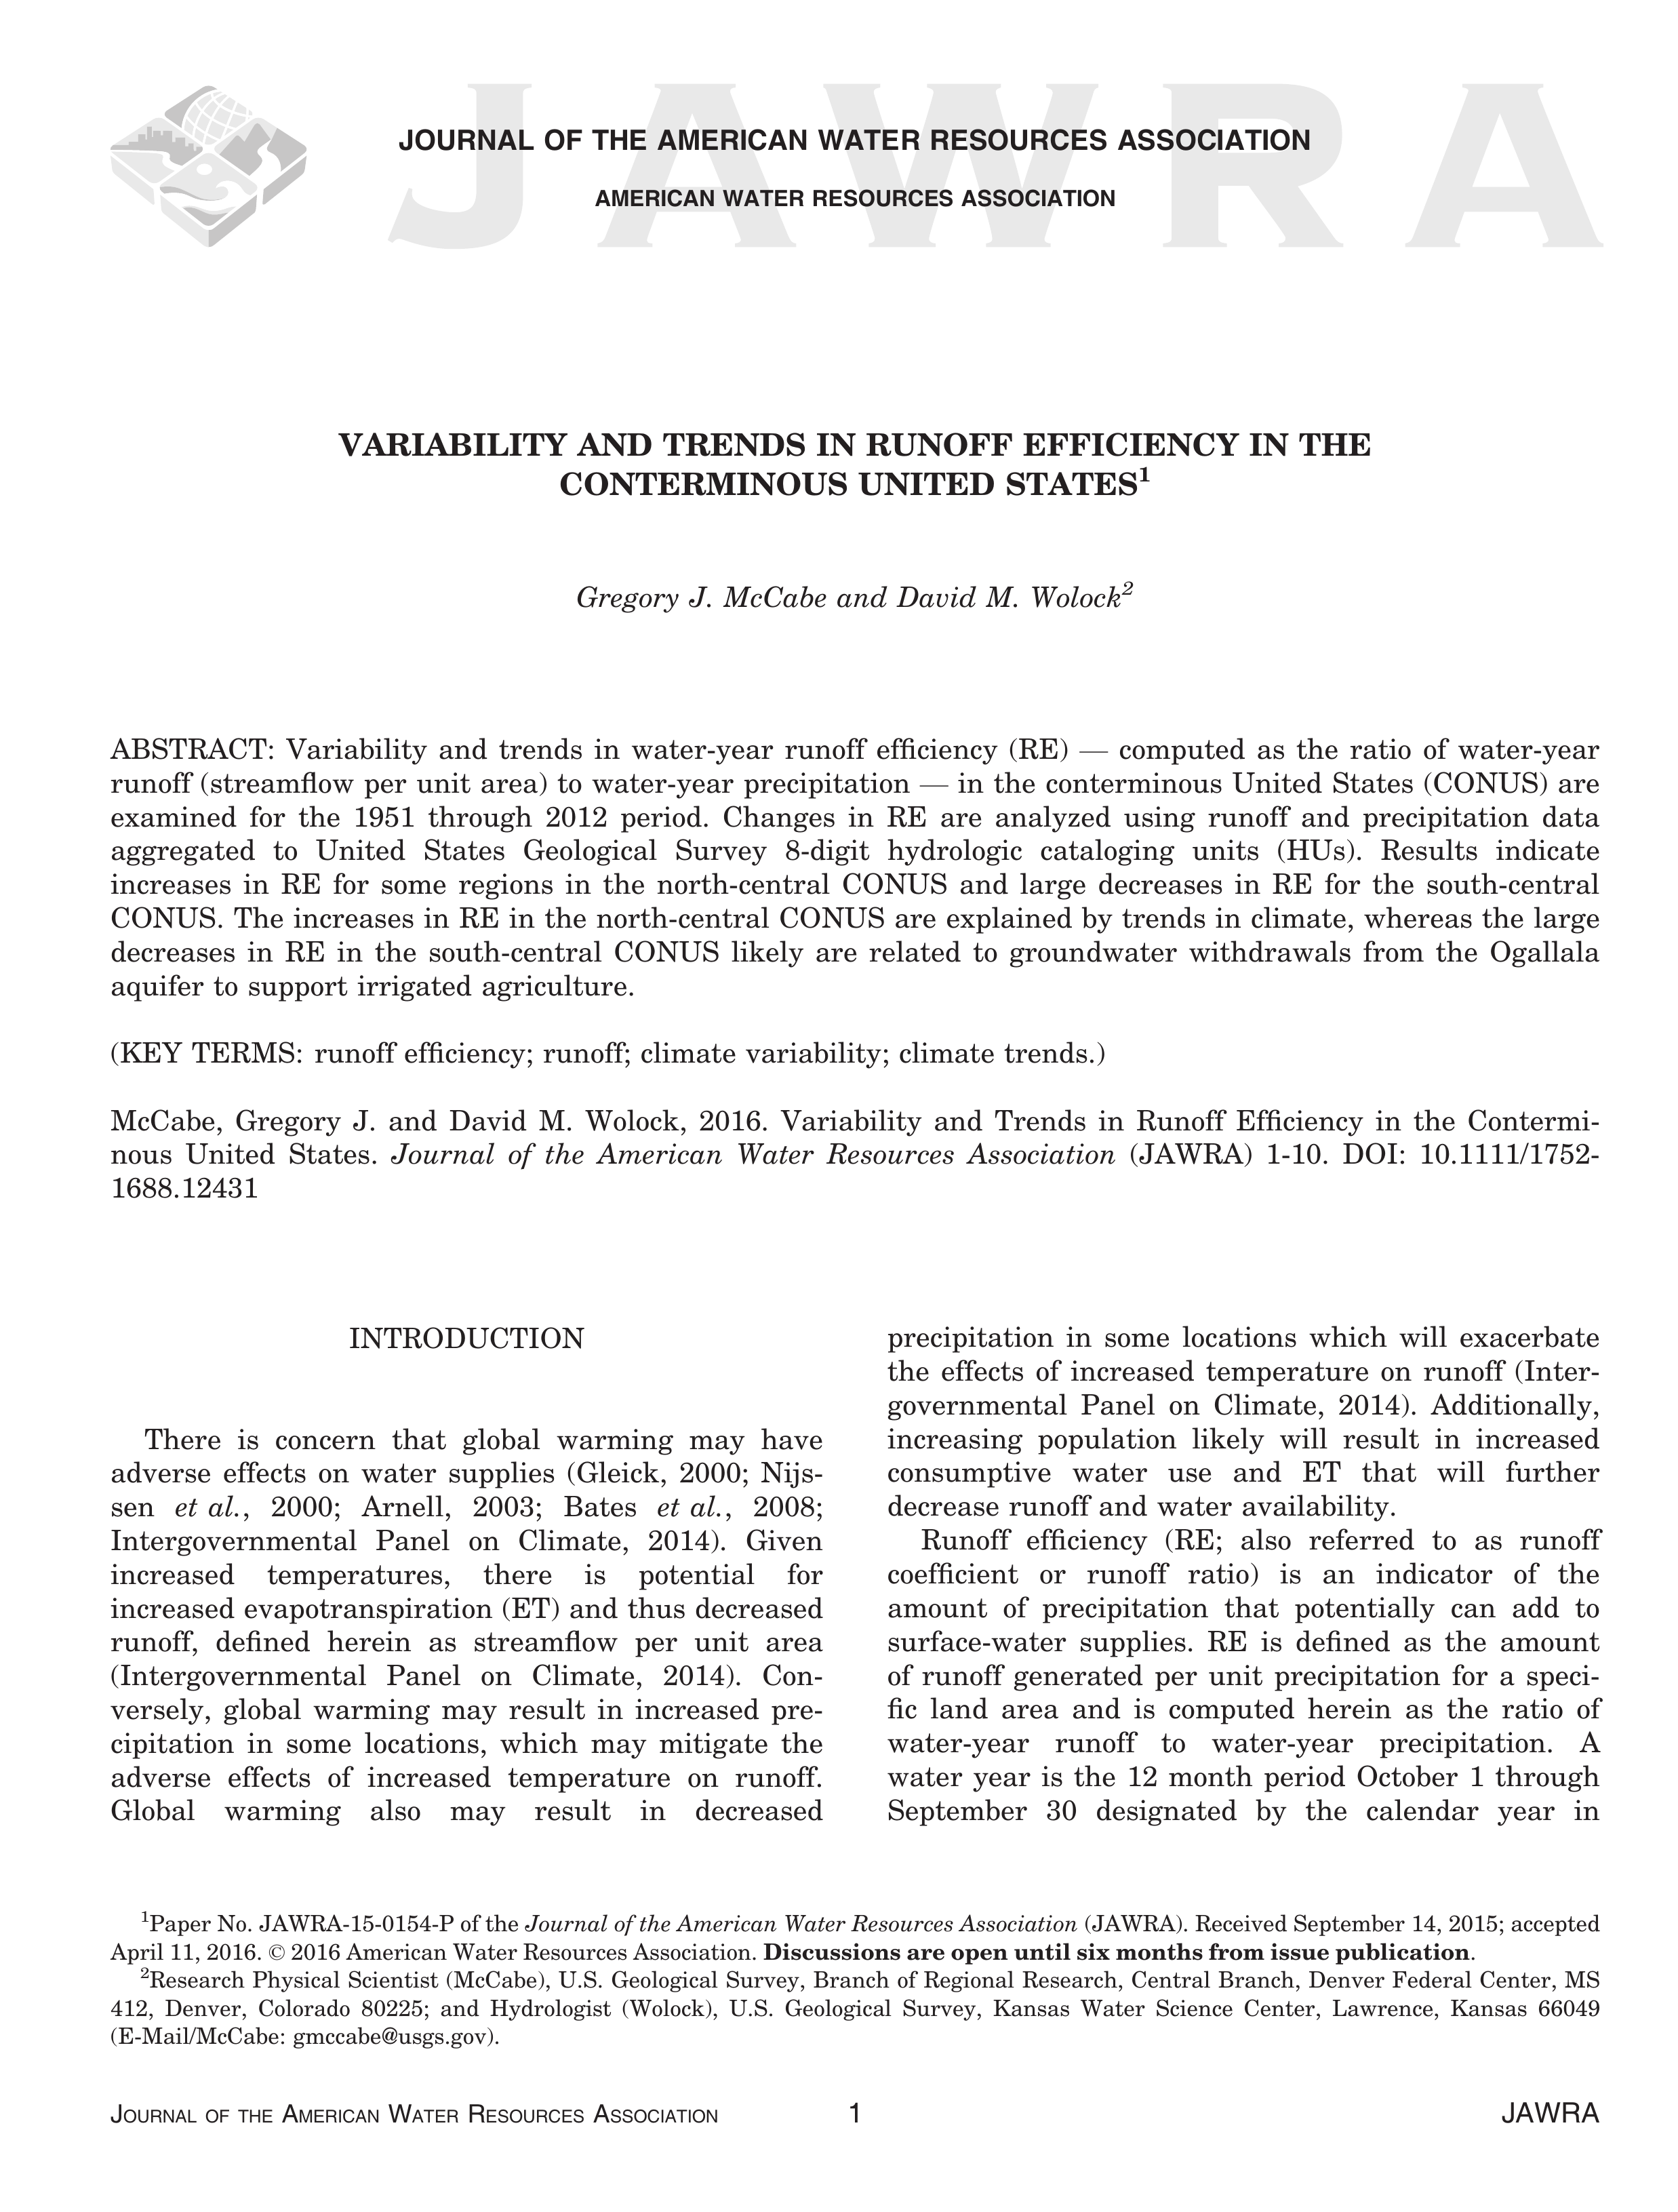
- Measured monthly runoff data for water-years 1951 through 2012 aggregated to HUC8’s.
- Monthly precipitation (in mm) and temperature (in °C) from PRISM used as inputs to a monthly water balance model to simulate monthly runoff for each HU for comparison with the measured monthly runoff.
- Regression and cluster analysis.
Reporting
Reporting

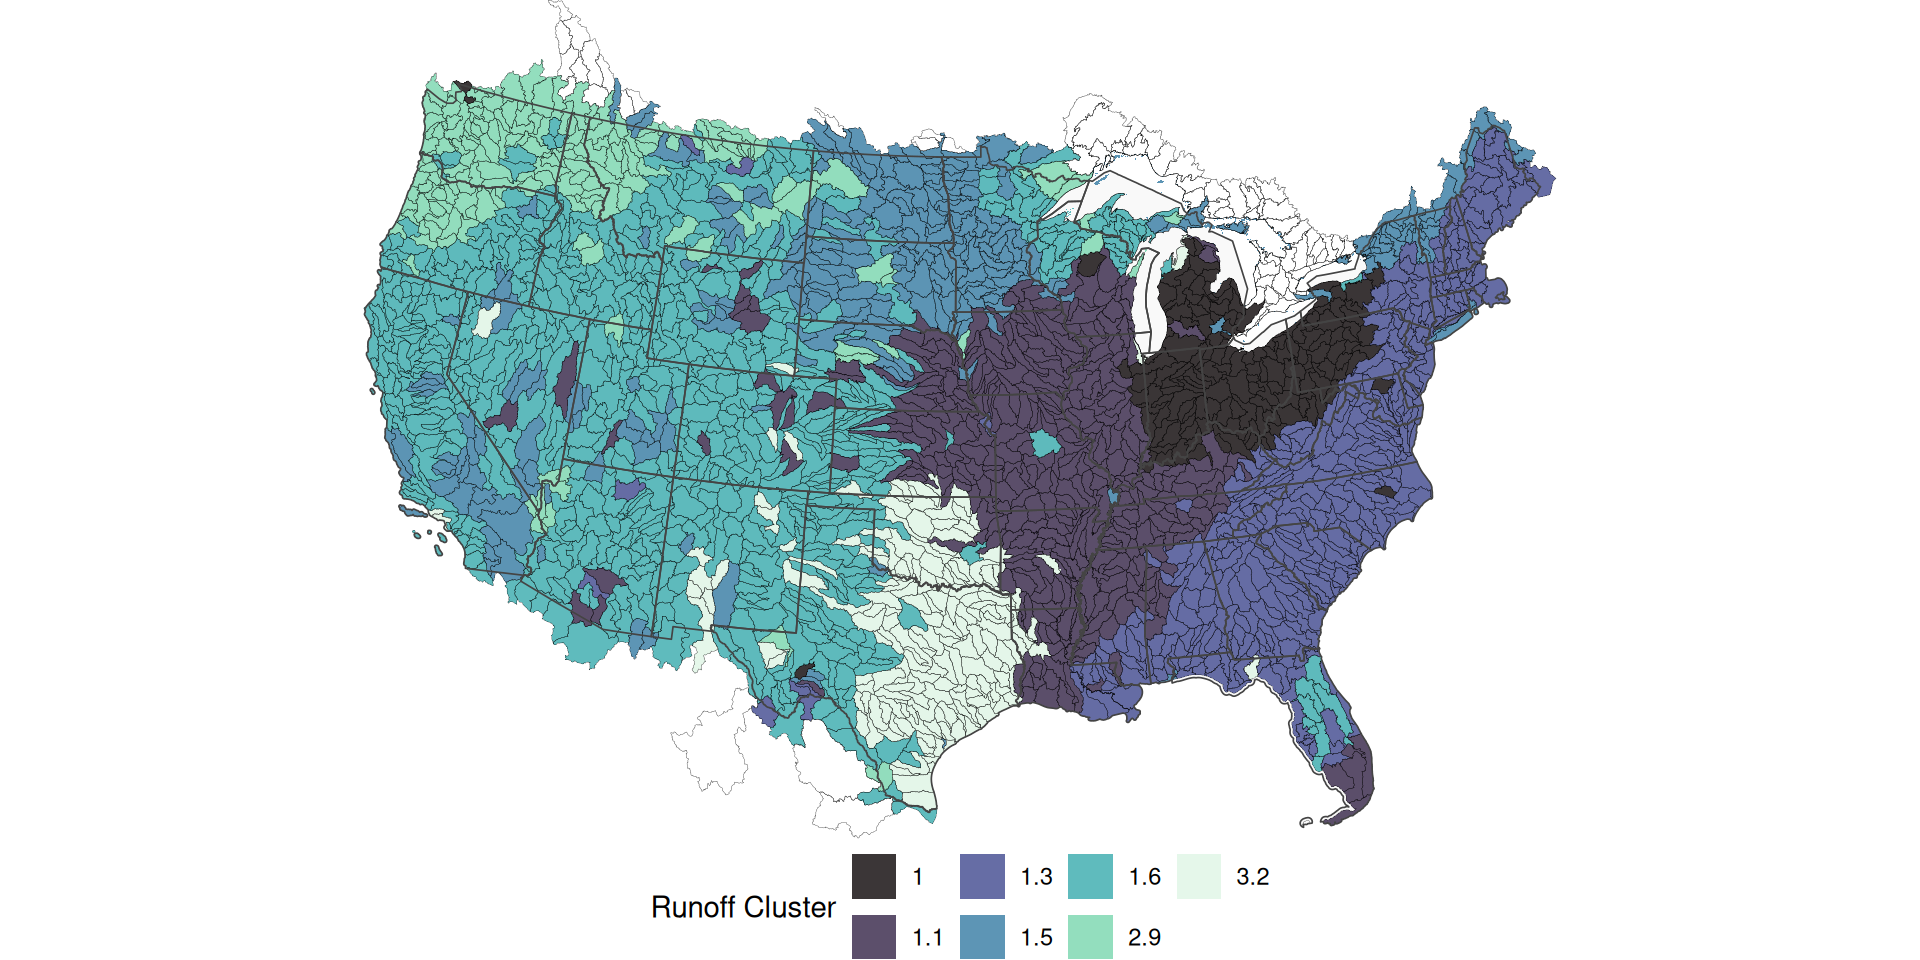
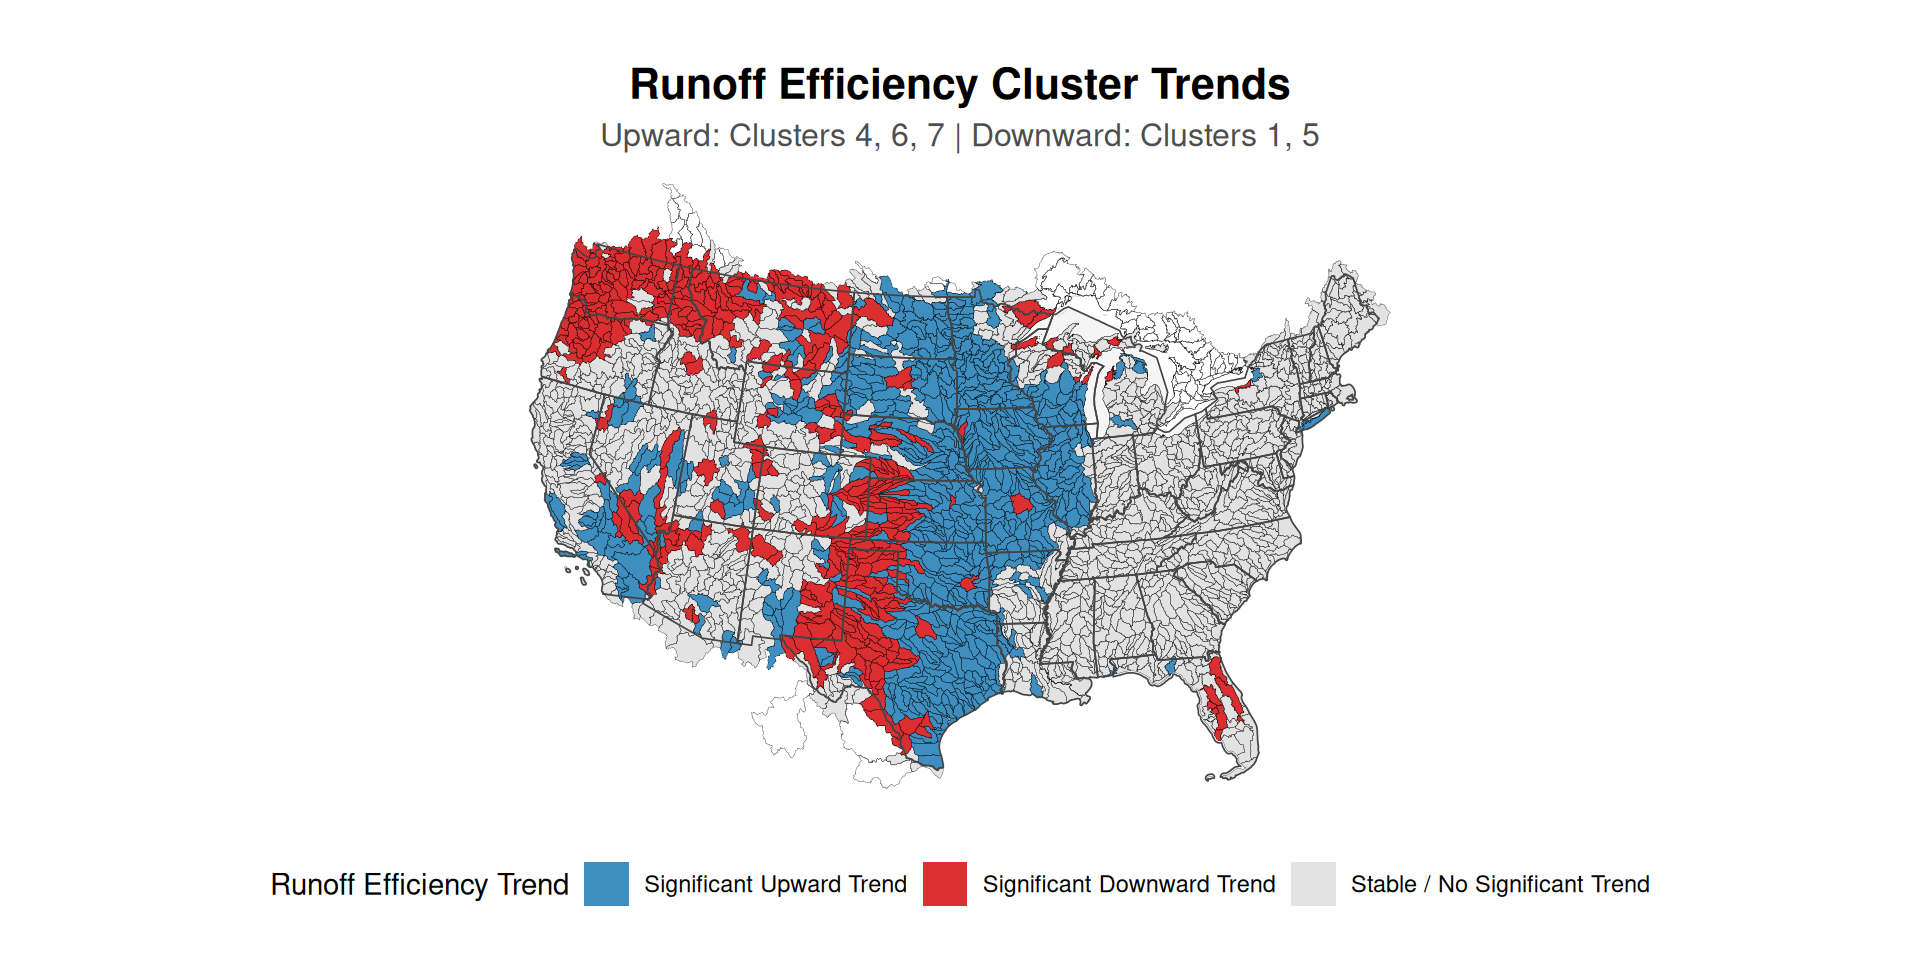
Extending their visualization
What have we learned?
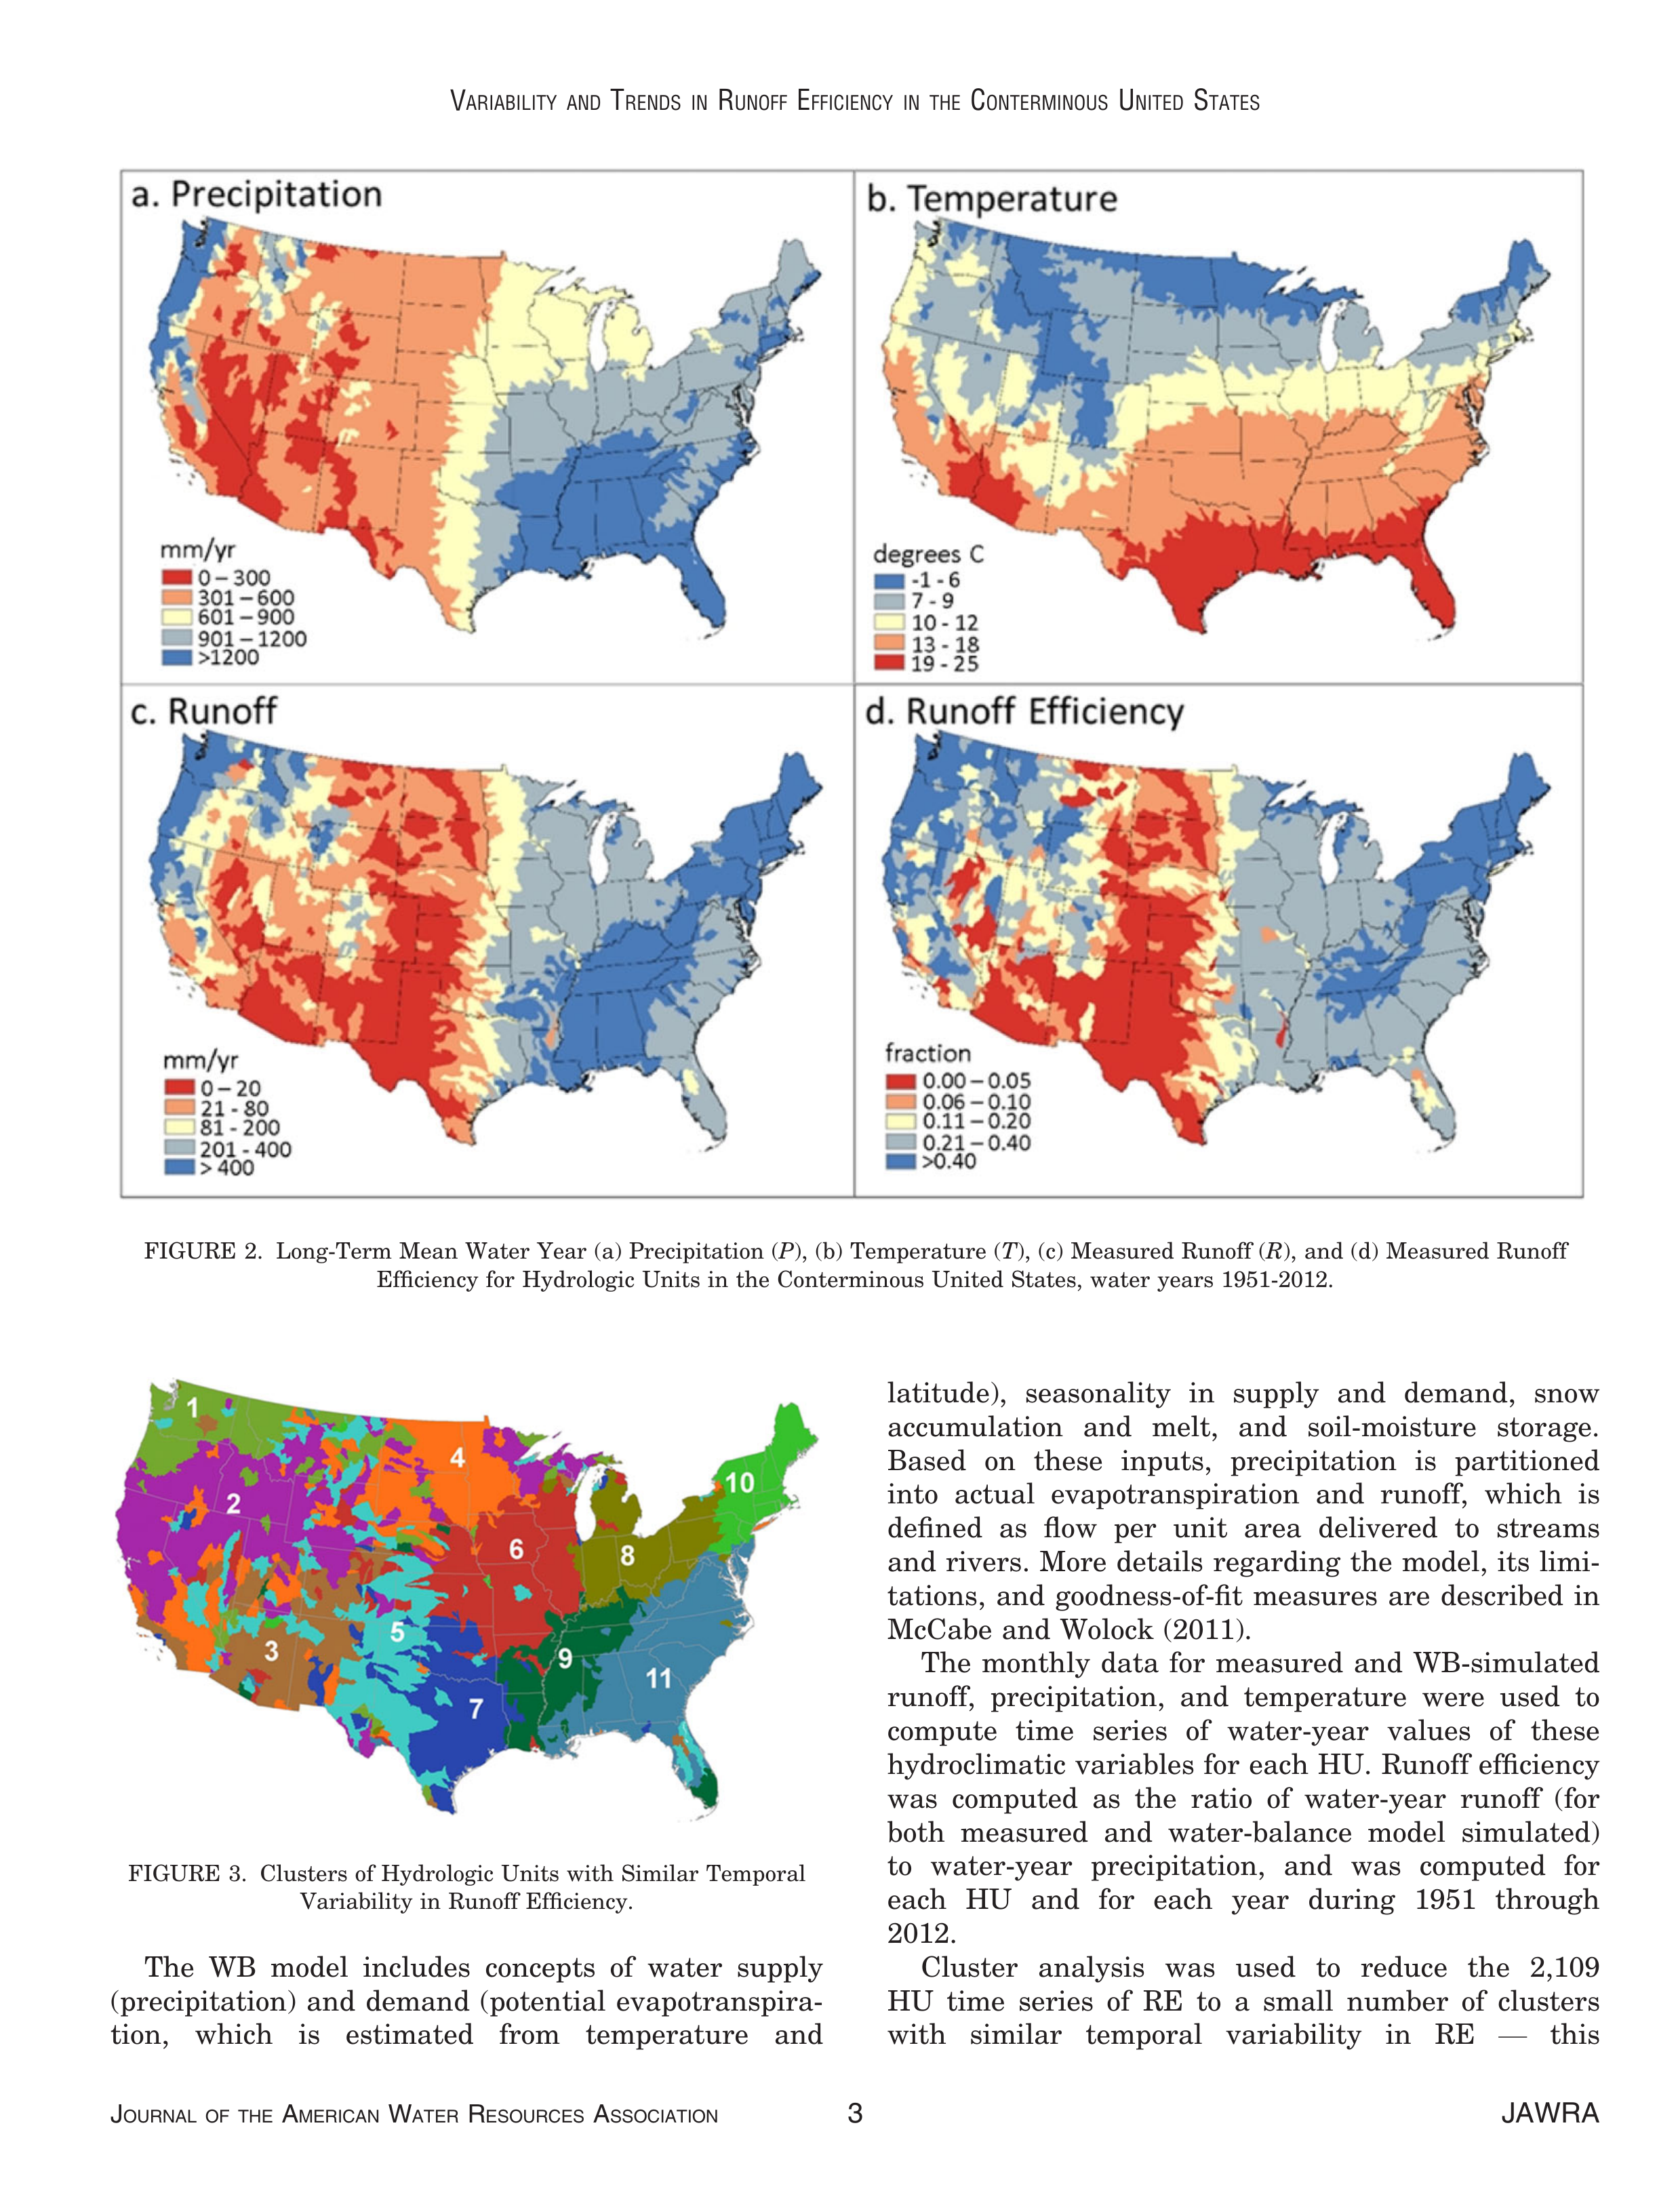
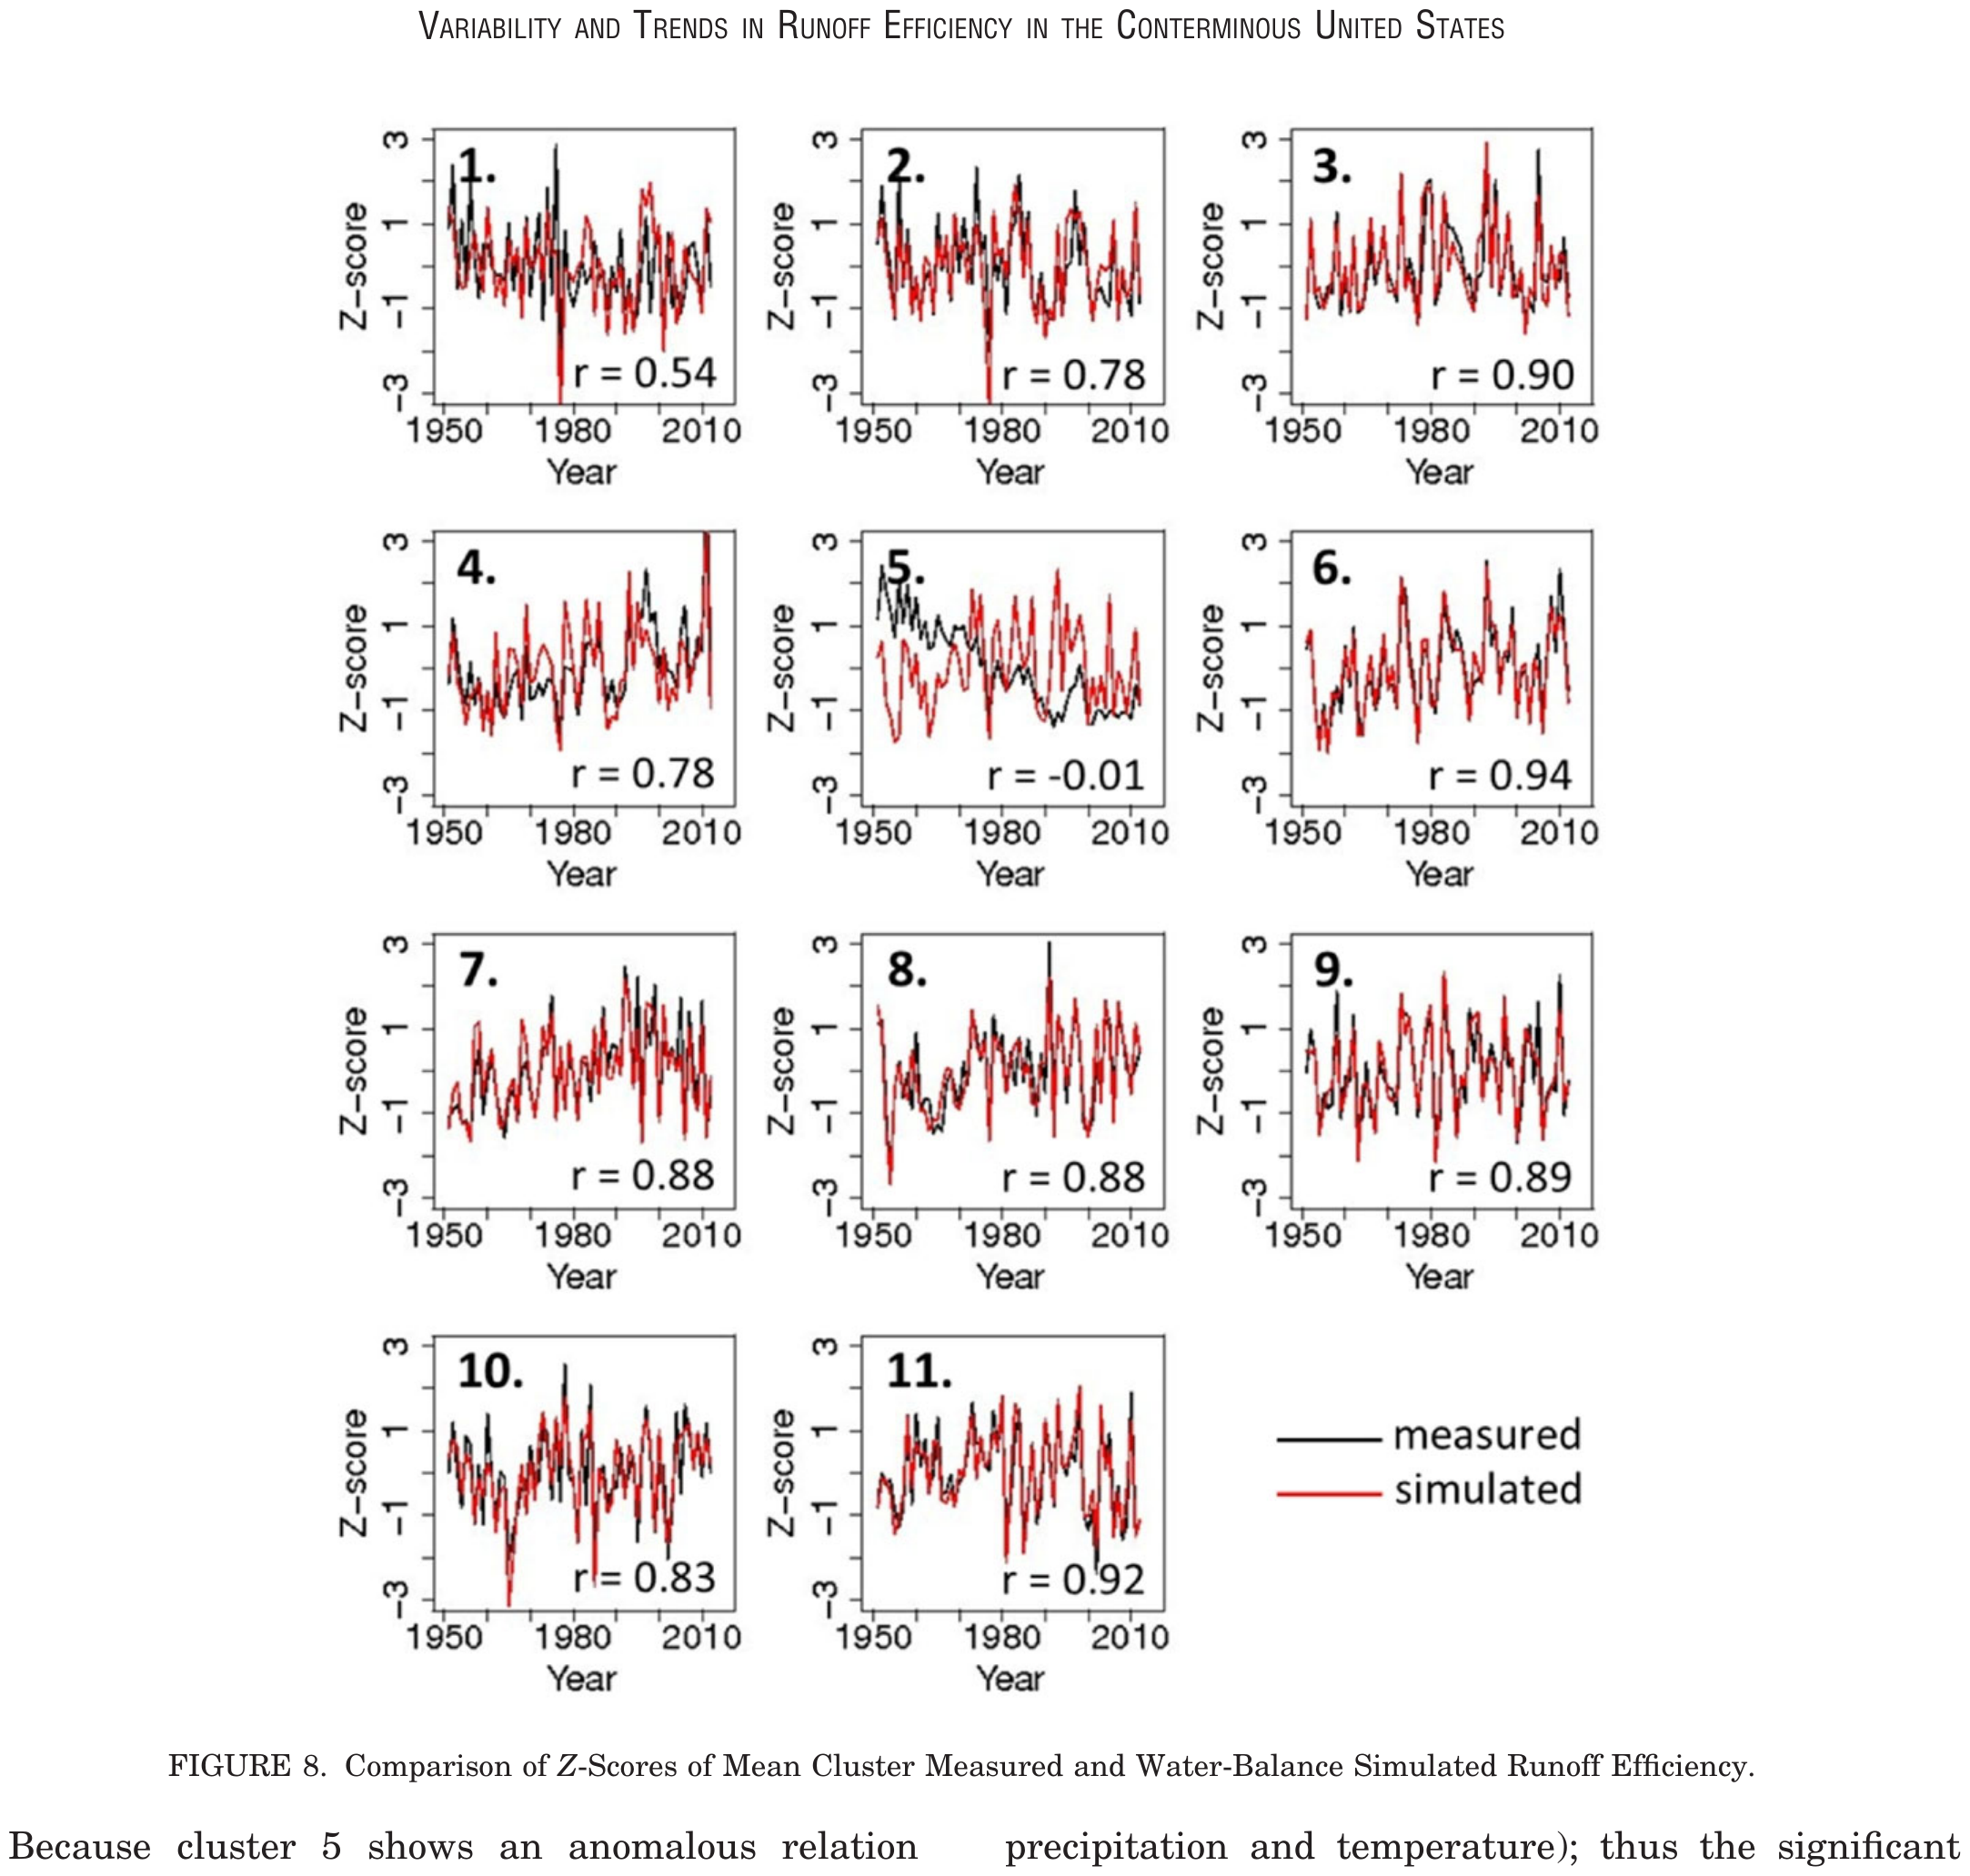
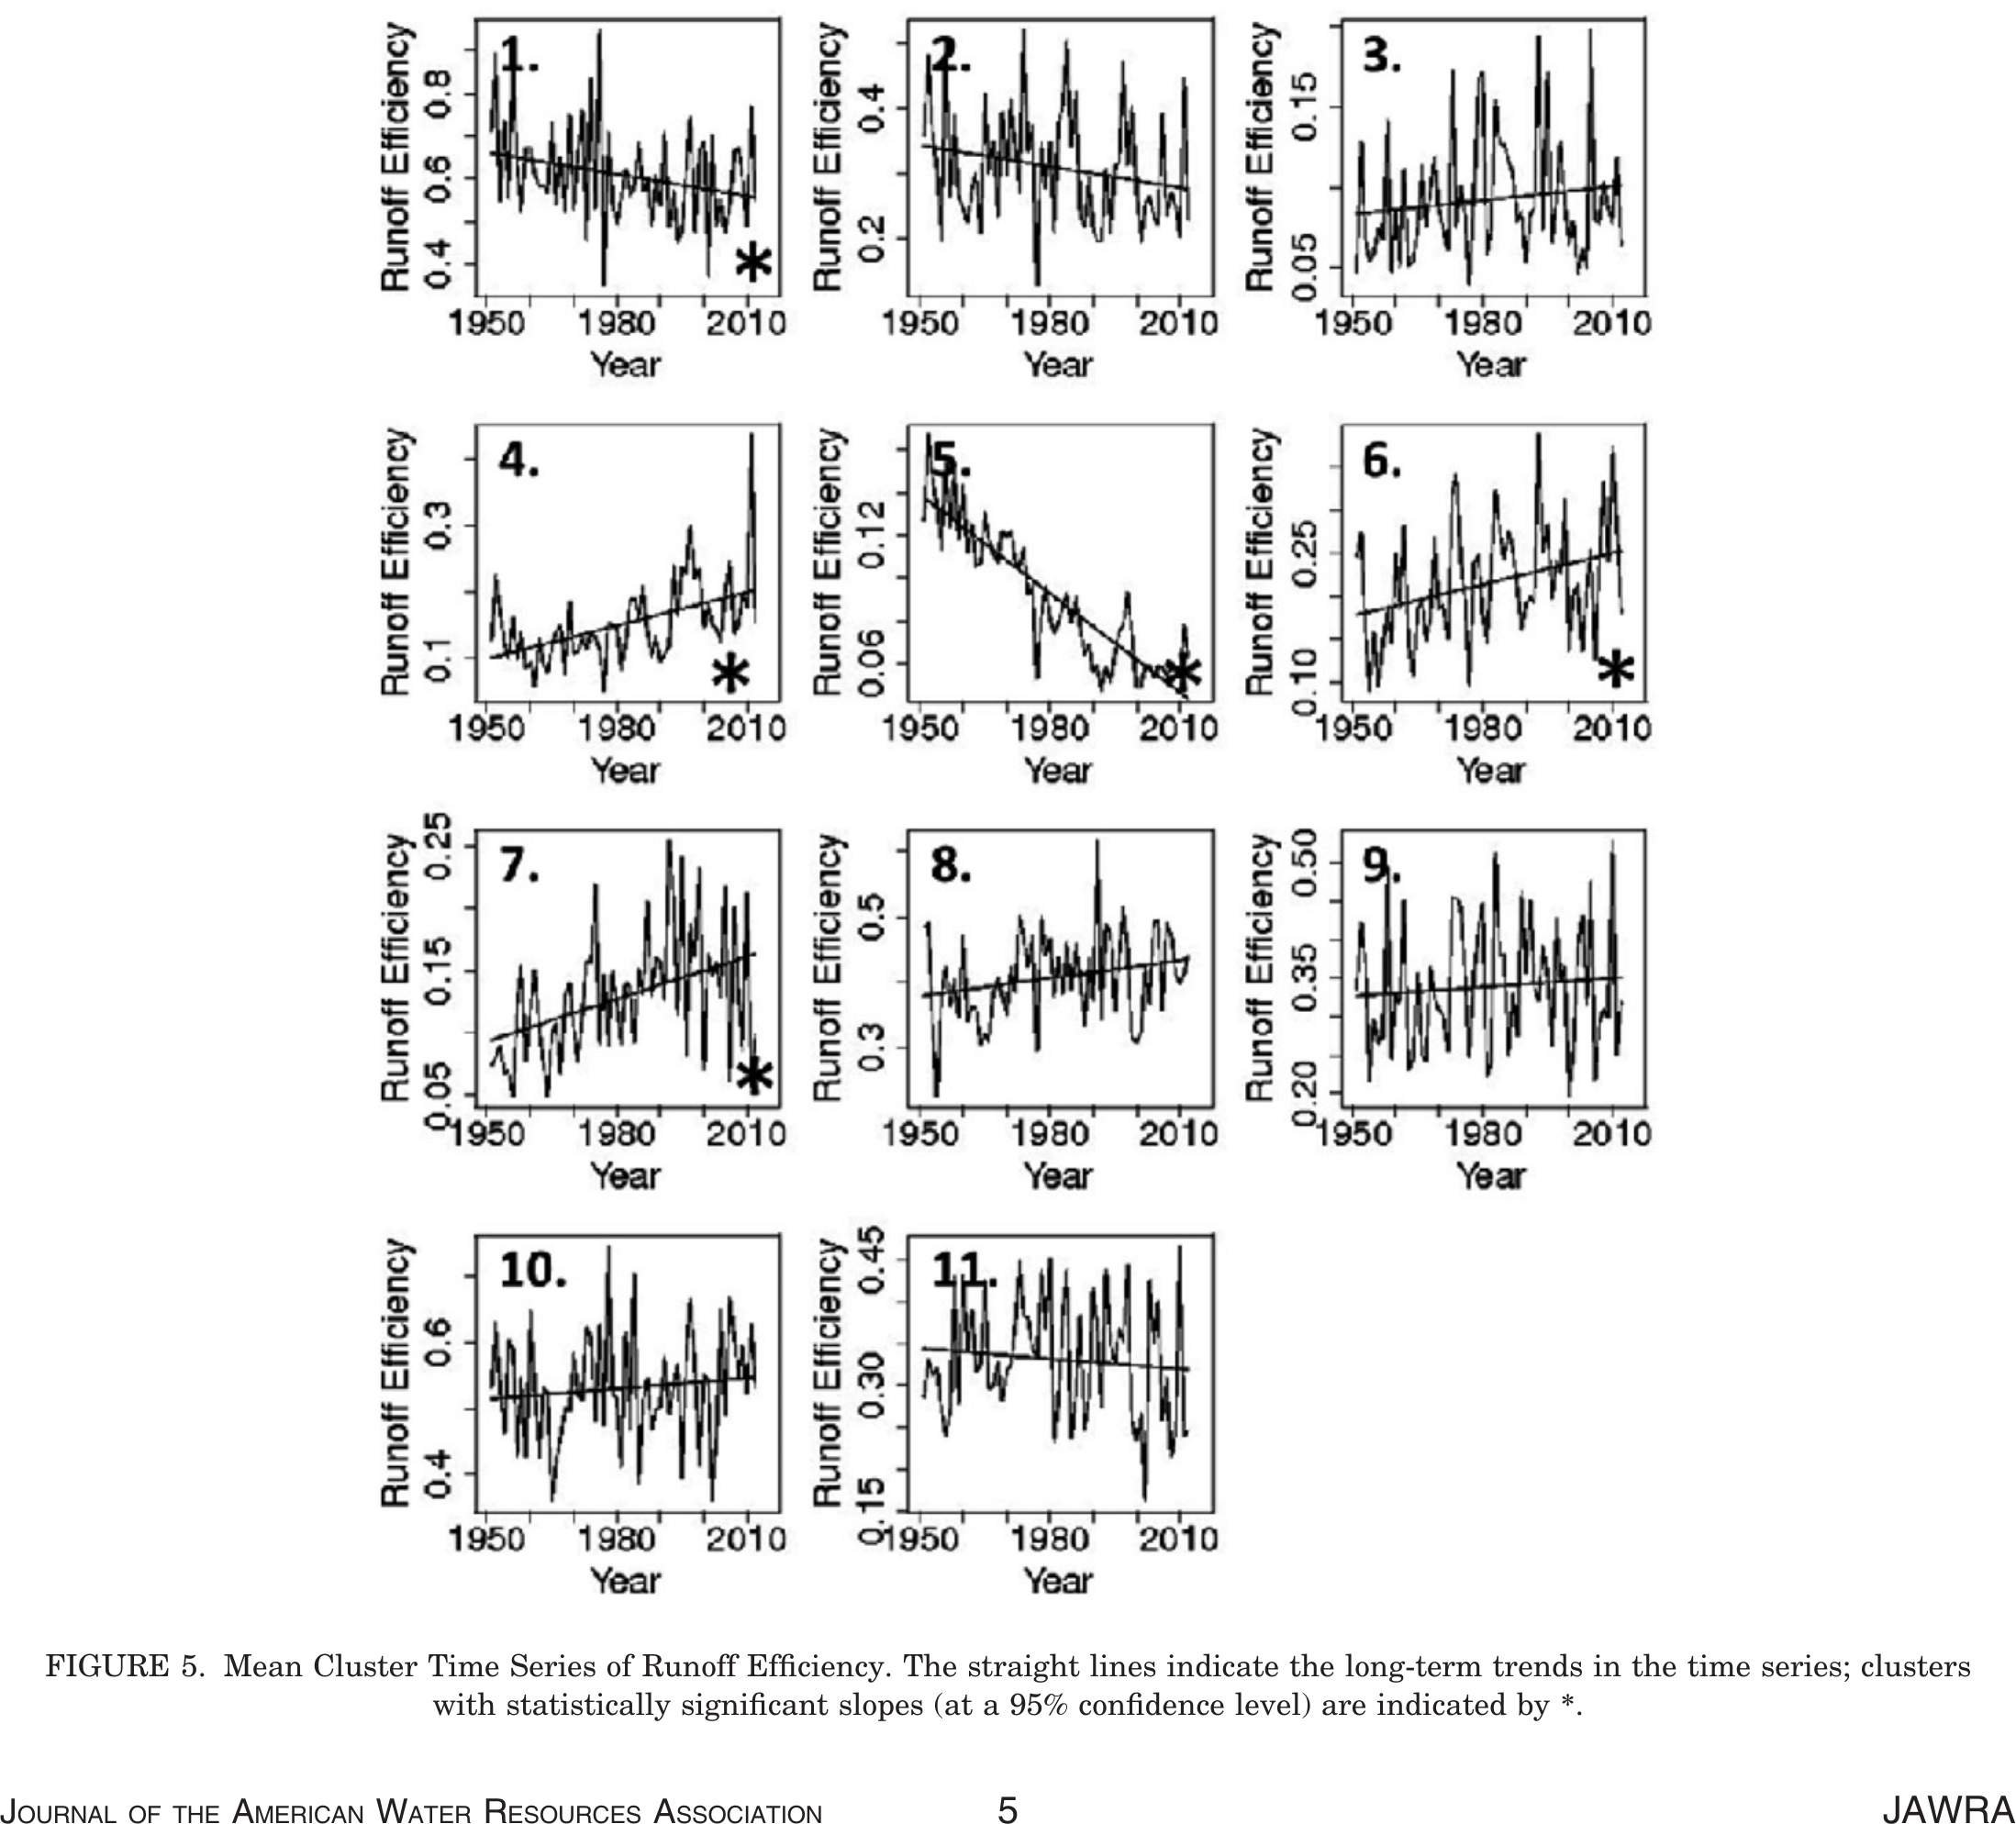
- Variability and trends in the time series of mean cluster runoff efficiency were examined and clustered
- Several statistically significant (p < 0.05) positively and negatively trending domains were identified
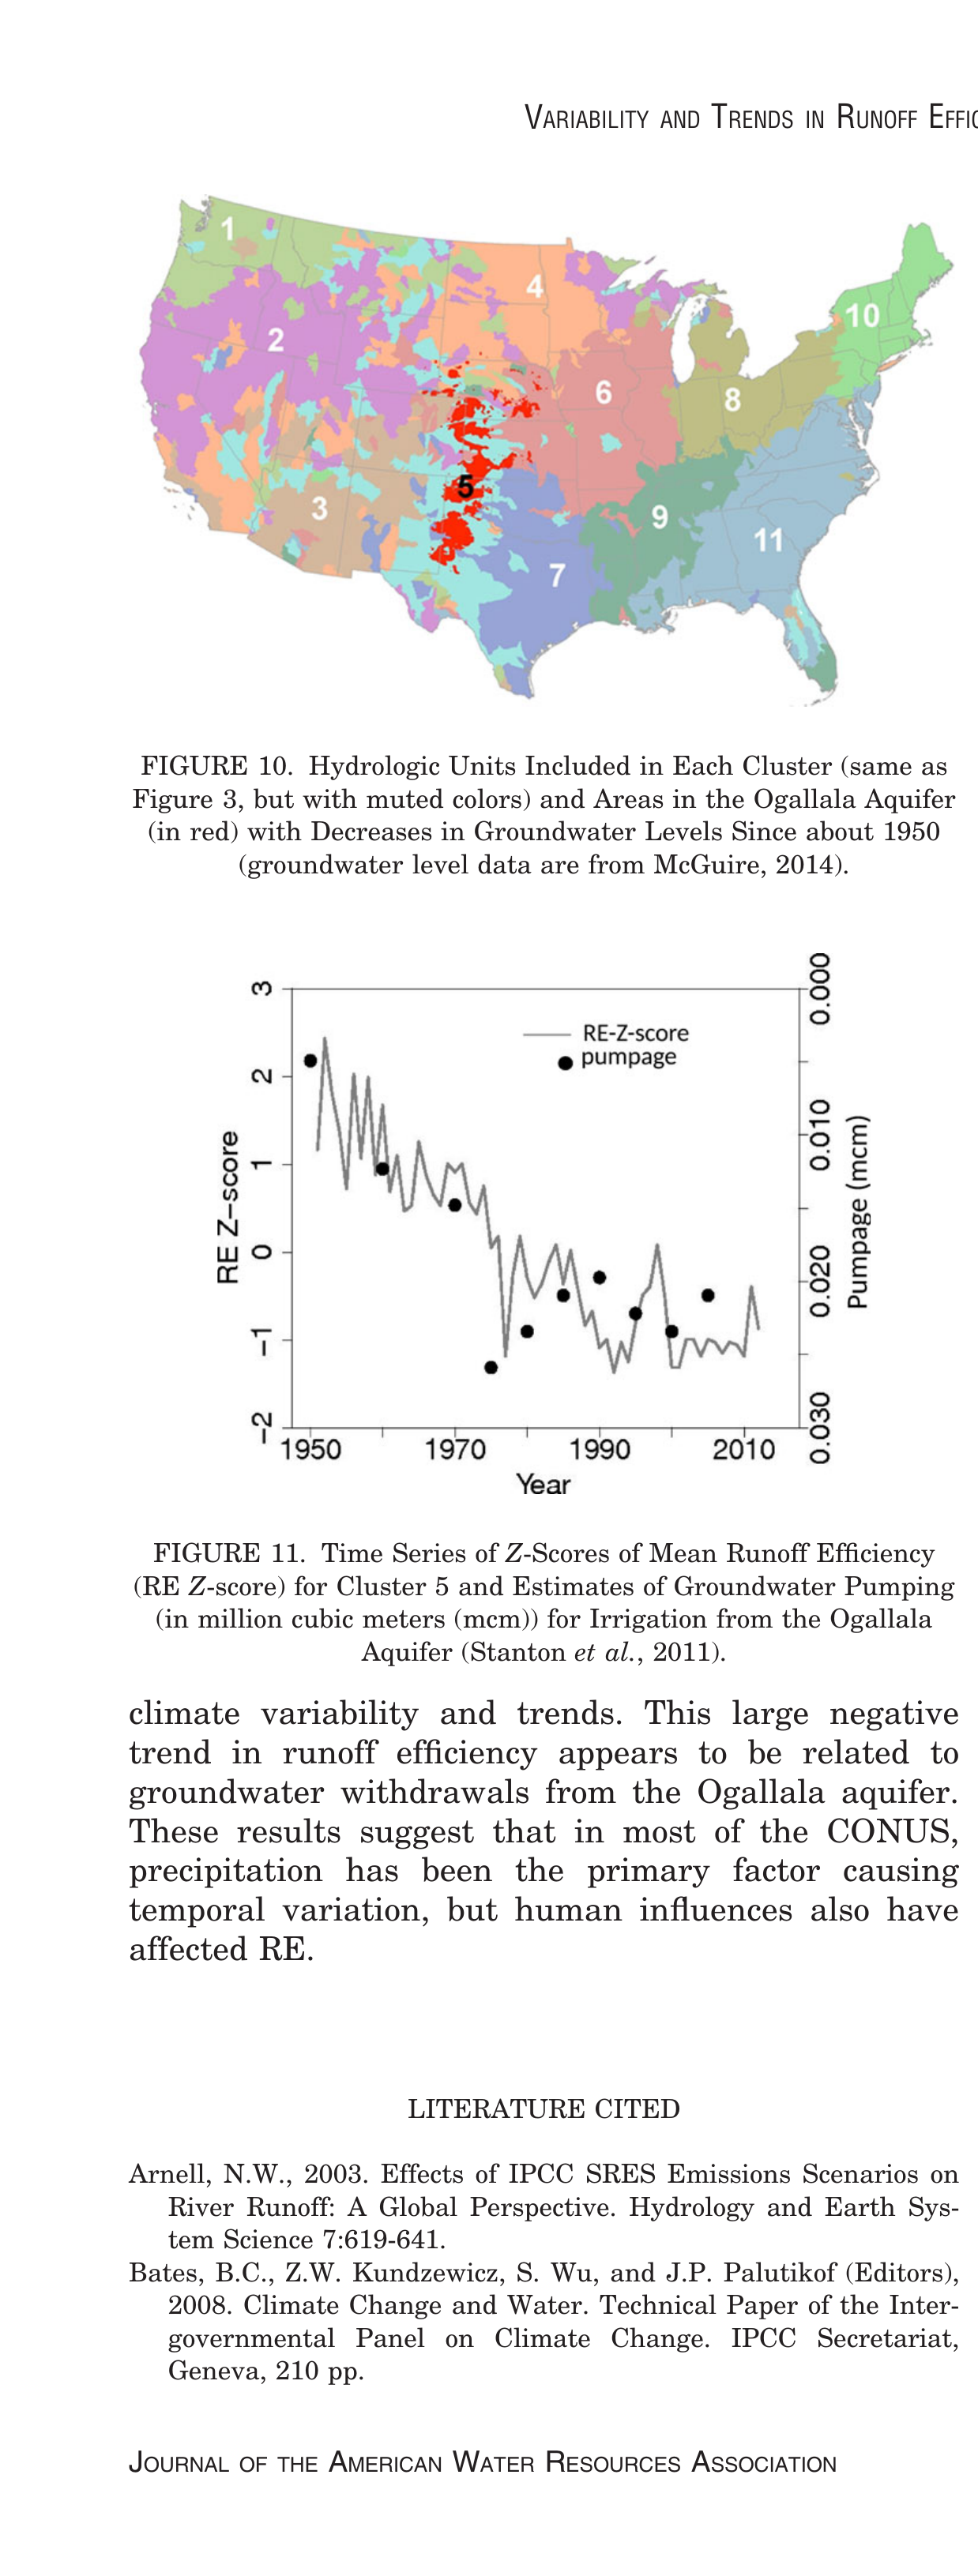
- All but one of these significant trends in runoff efficiency can be explained by trends and variability in climate (primarily precipitation); groundwater withdrawals hypothisized for the other.