Improving Exceedence Values for FIM Visualization
Goals:
- To improve the return period flow used to visualize FIM.
Outcomes and Takeaways:
- A prototype dataset to start further iterations.
- A deeper appreciation for the forecast-to-operations process.
- A better grasp of the tangled dependencies of this wicked system.
Slide layout: default Items linked/bordered in green are cited in the tooltip on hover.
: narrative-oriented Items linked/bordered in blue are hyperlinked to relevant resources.
Terminology Levelset
- Bankfull discharge: A largely geomorphic term that calls out a discharge that is typically intended to conceptually represent the discharge needed to deposit sediment on the banks.
- Bankfill flow -or- Flow at bankfill stage: This is an OWP-centric term that is used to define the flow at which we “turn on” the automatic visualization of FIM services.
- Return Period (RP): A calculation that places a given flow in context with the historic flows that are typically expected within the system. Often a direct statistical calculation (and extrapolation) from long-running observation sites.
- Annual Exceedance Probabilities (AEP): The probability that a flow of a specific magnitude will be equaled or exceeded in any given year.
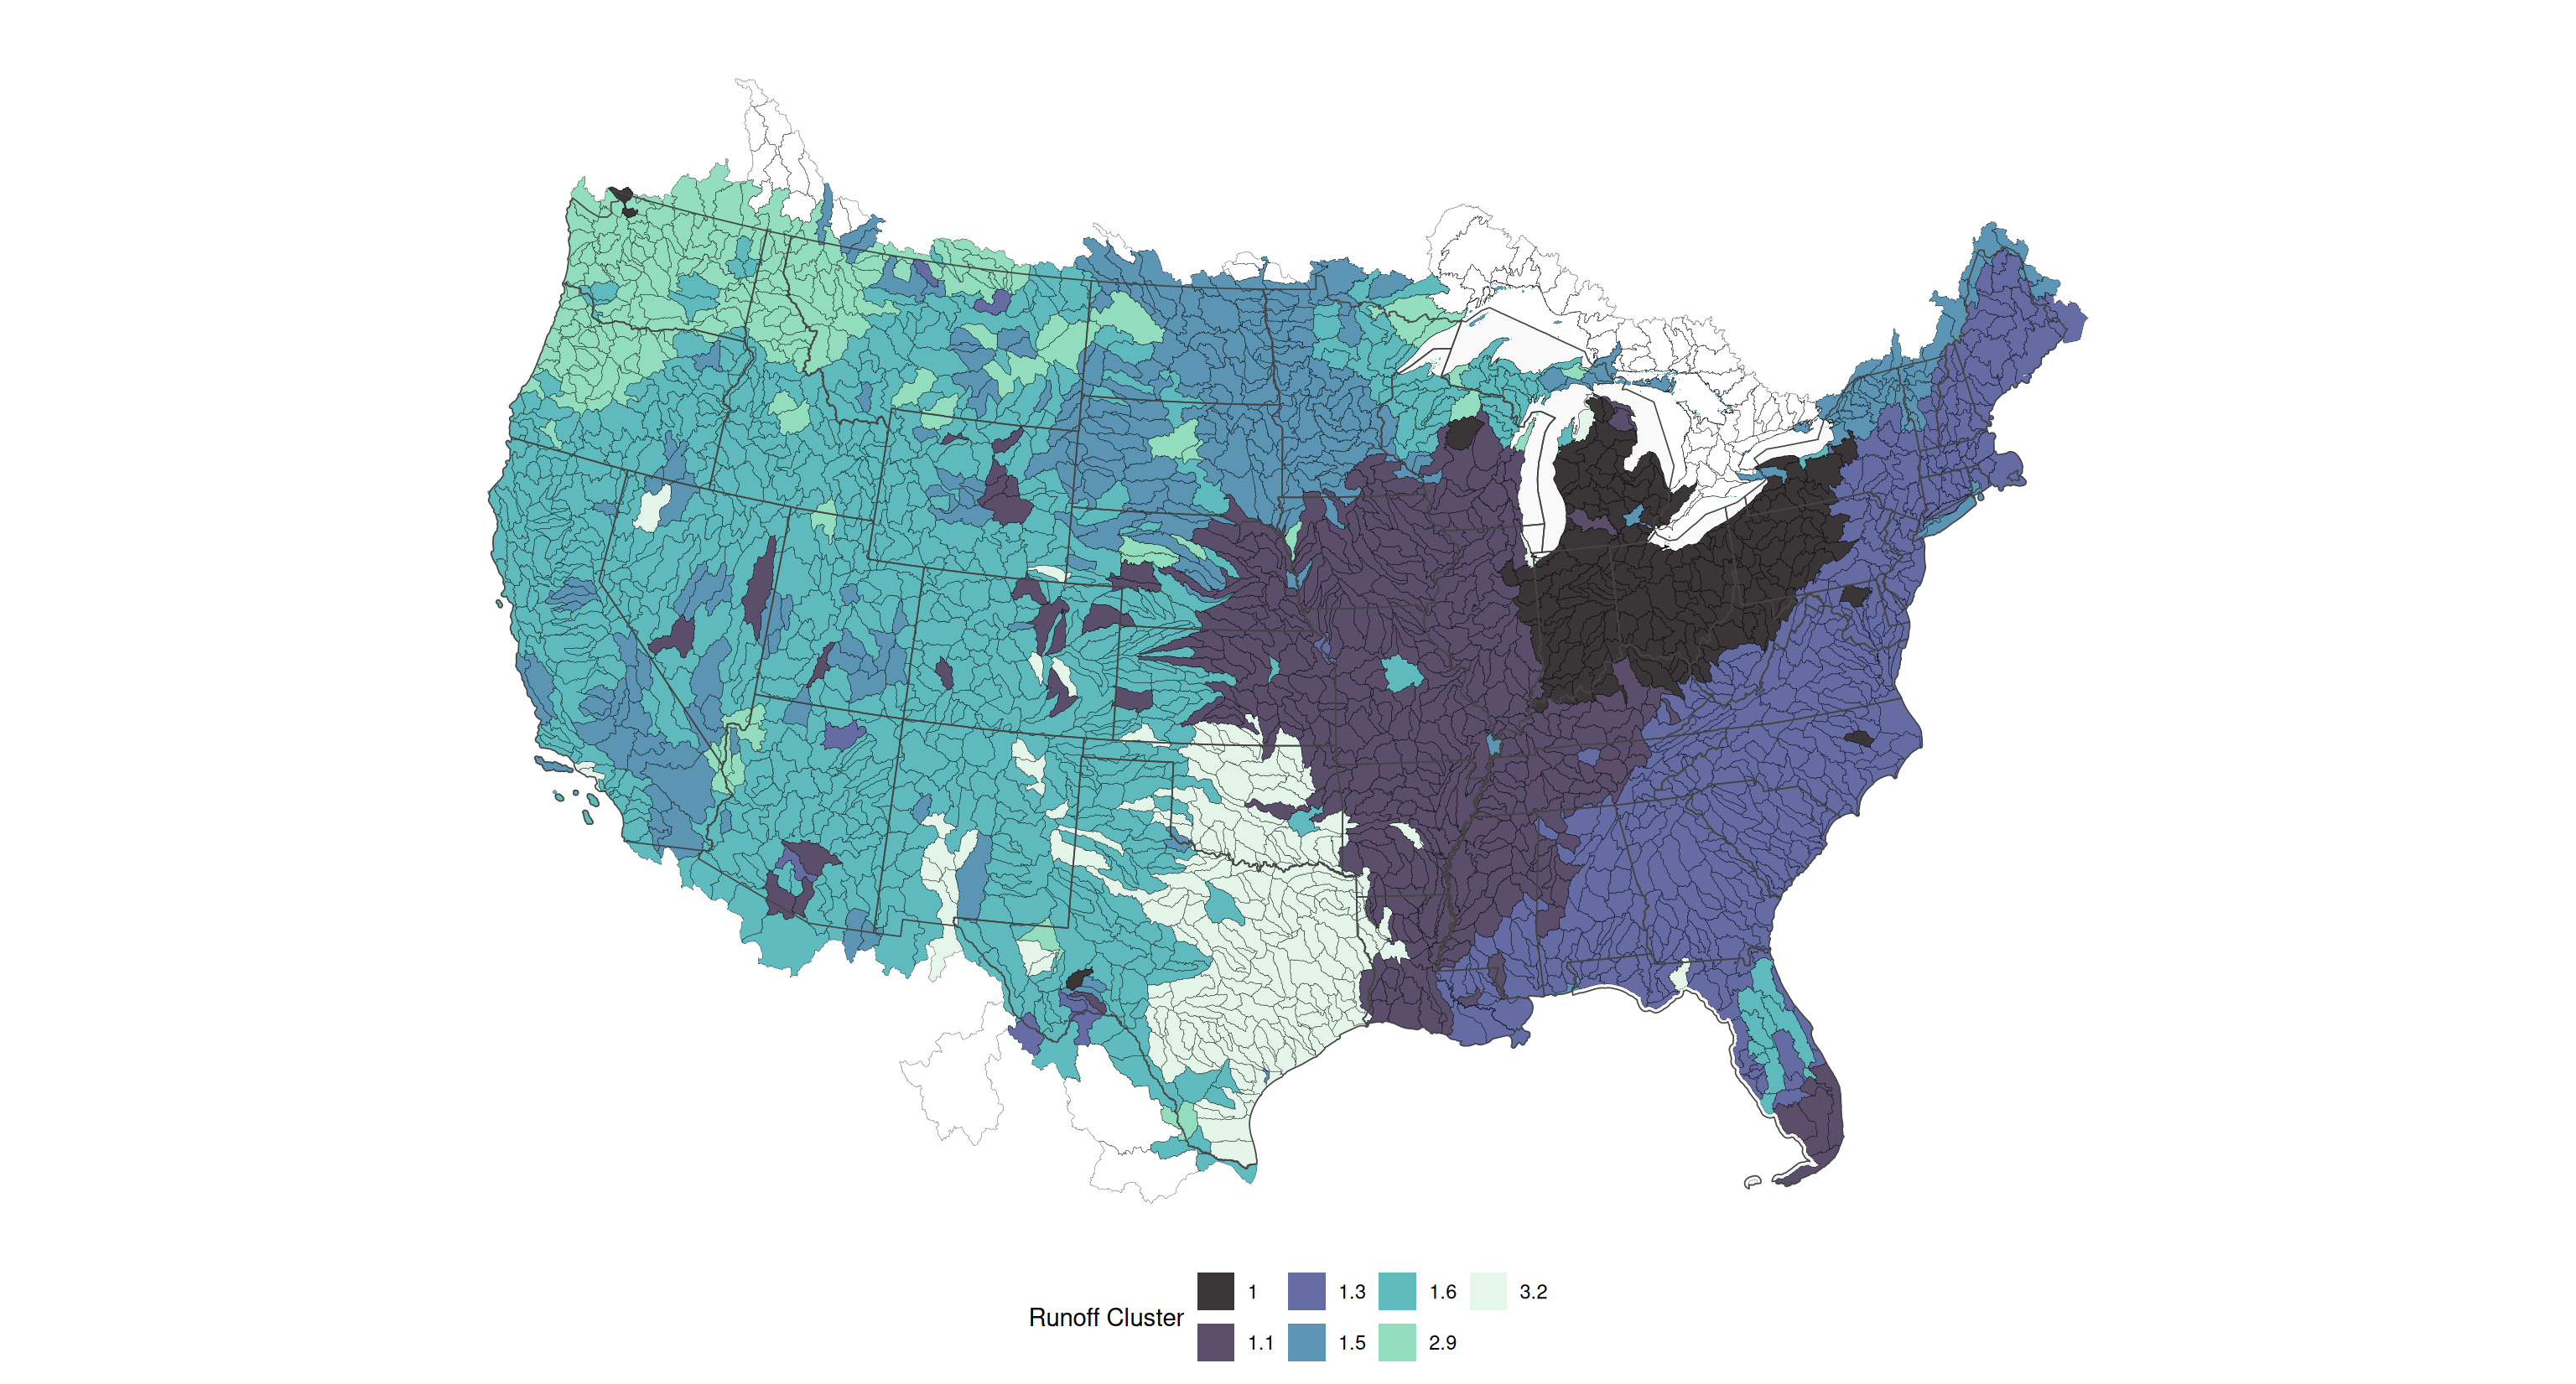
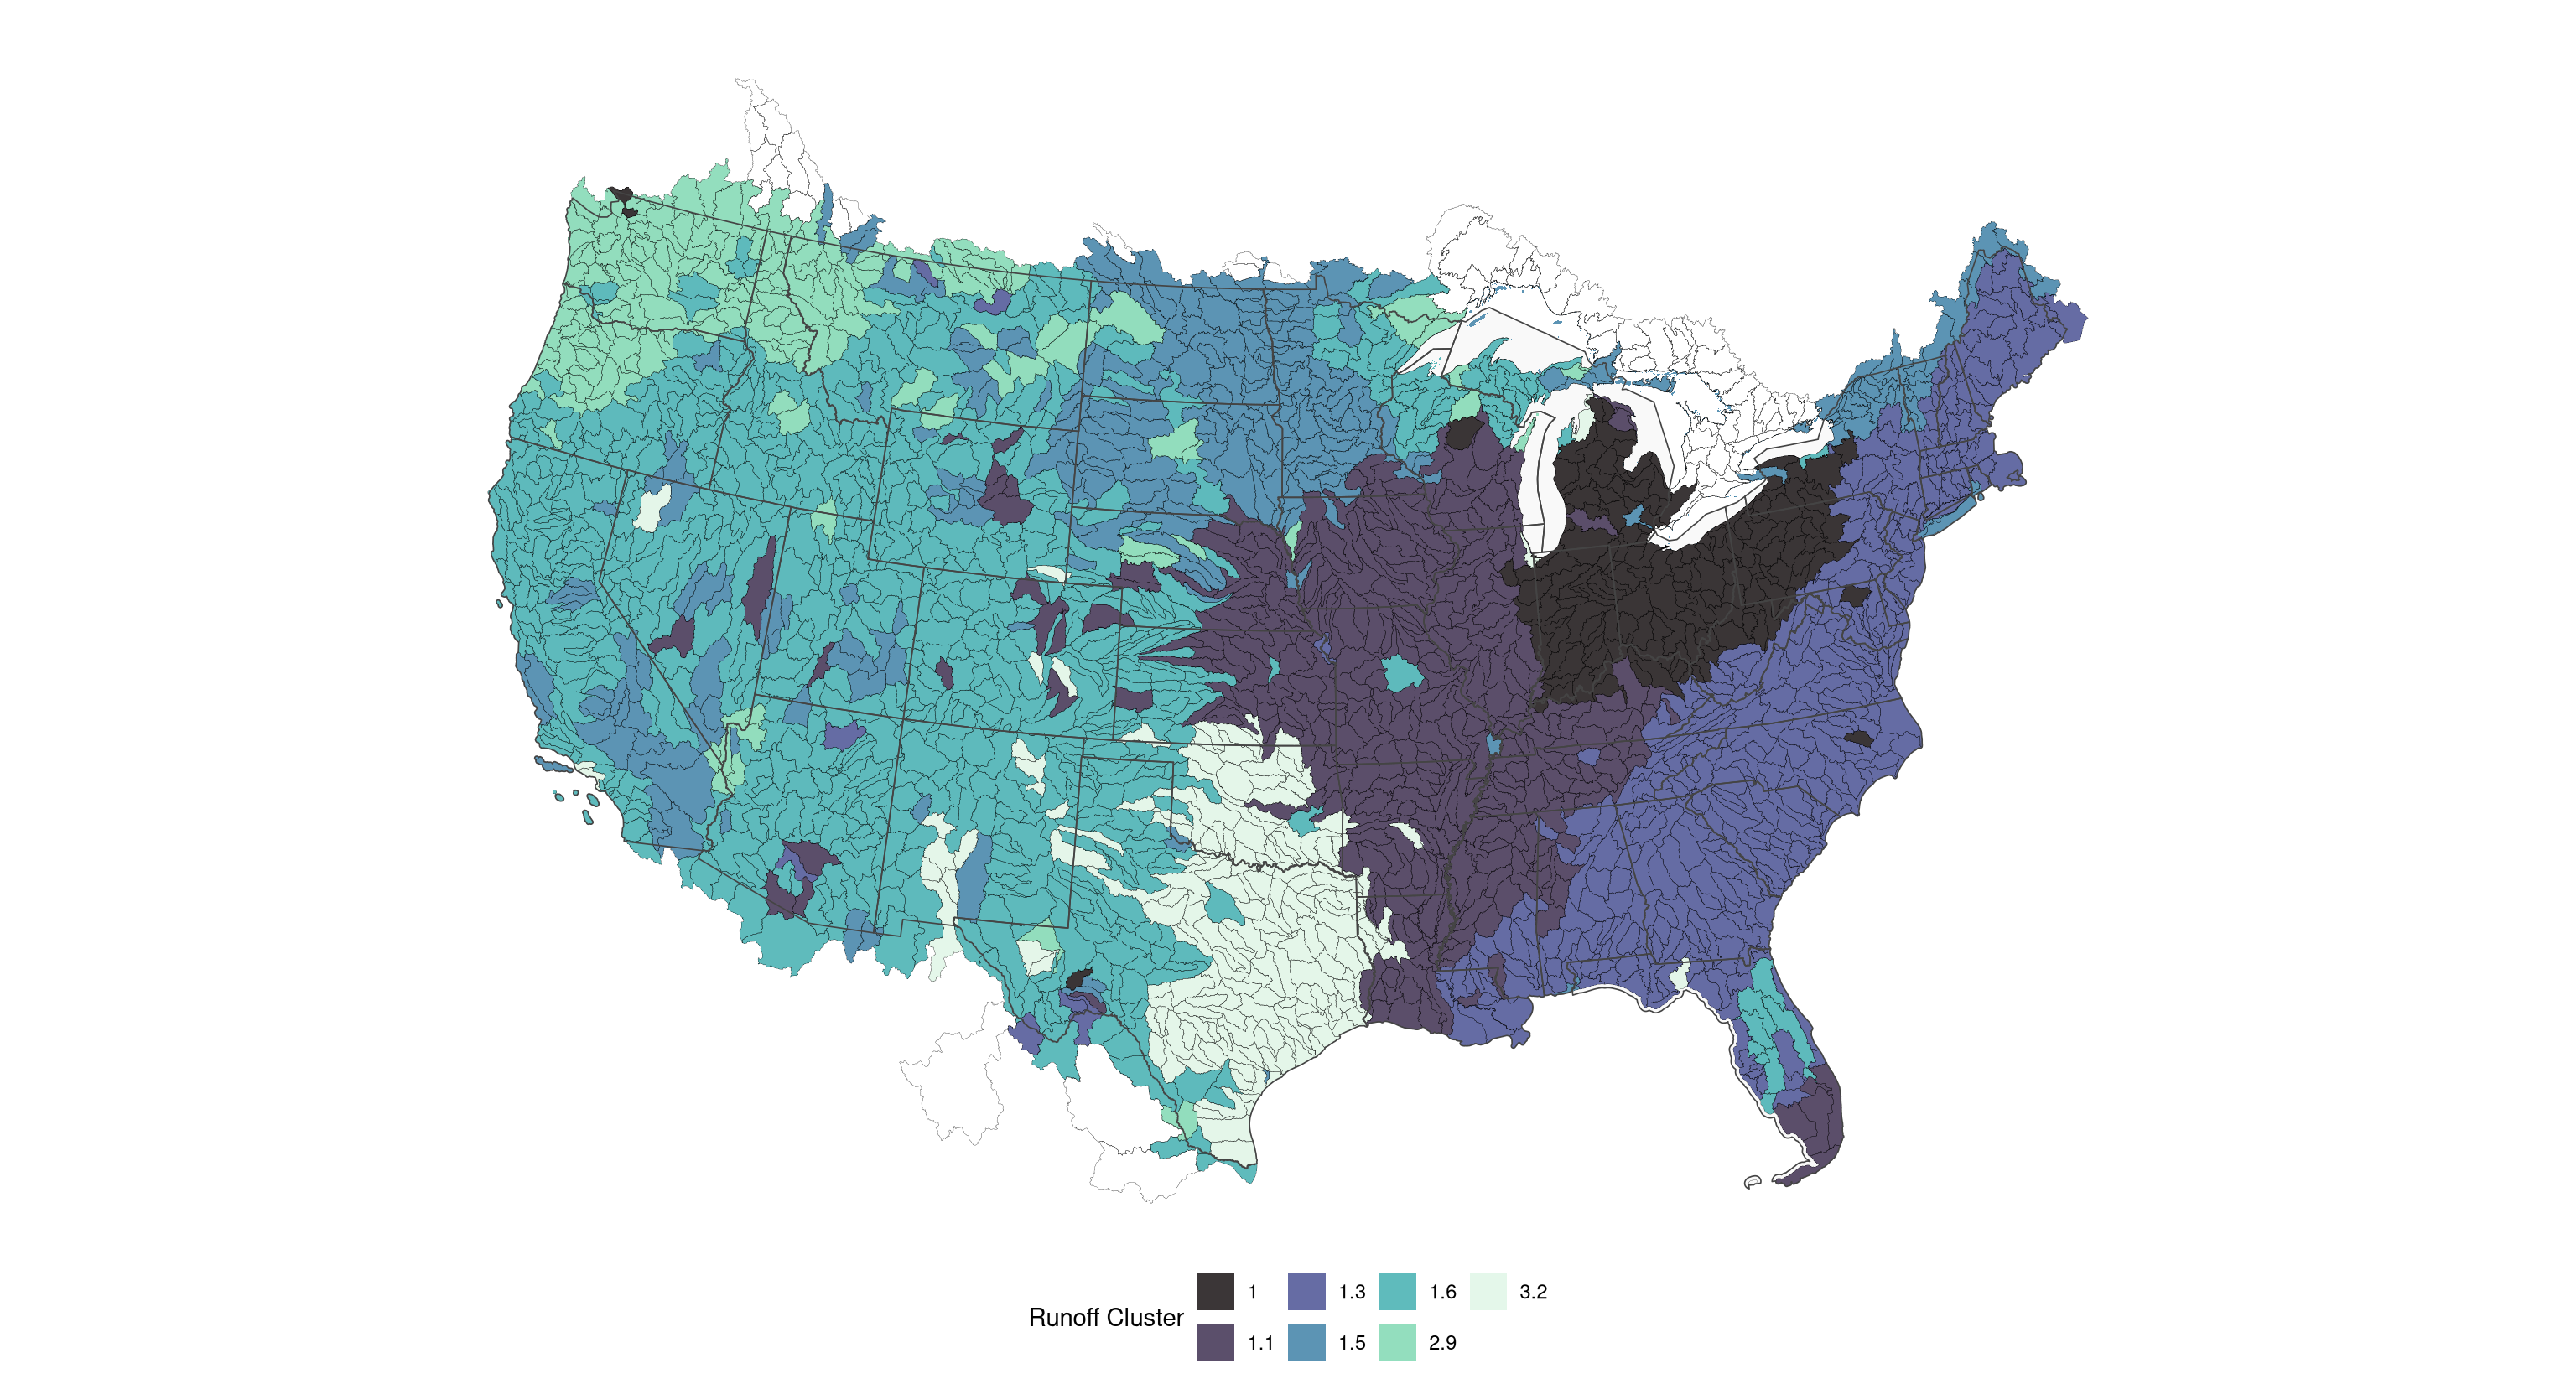
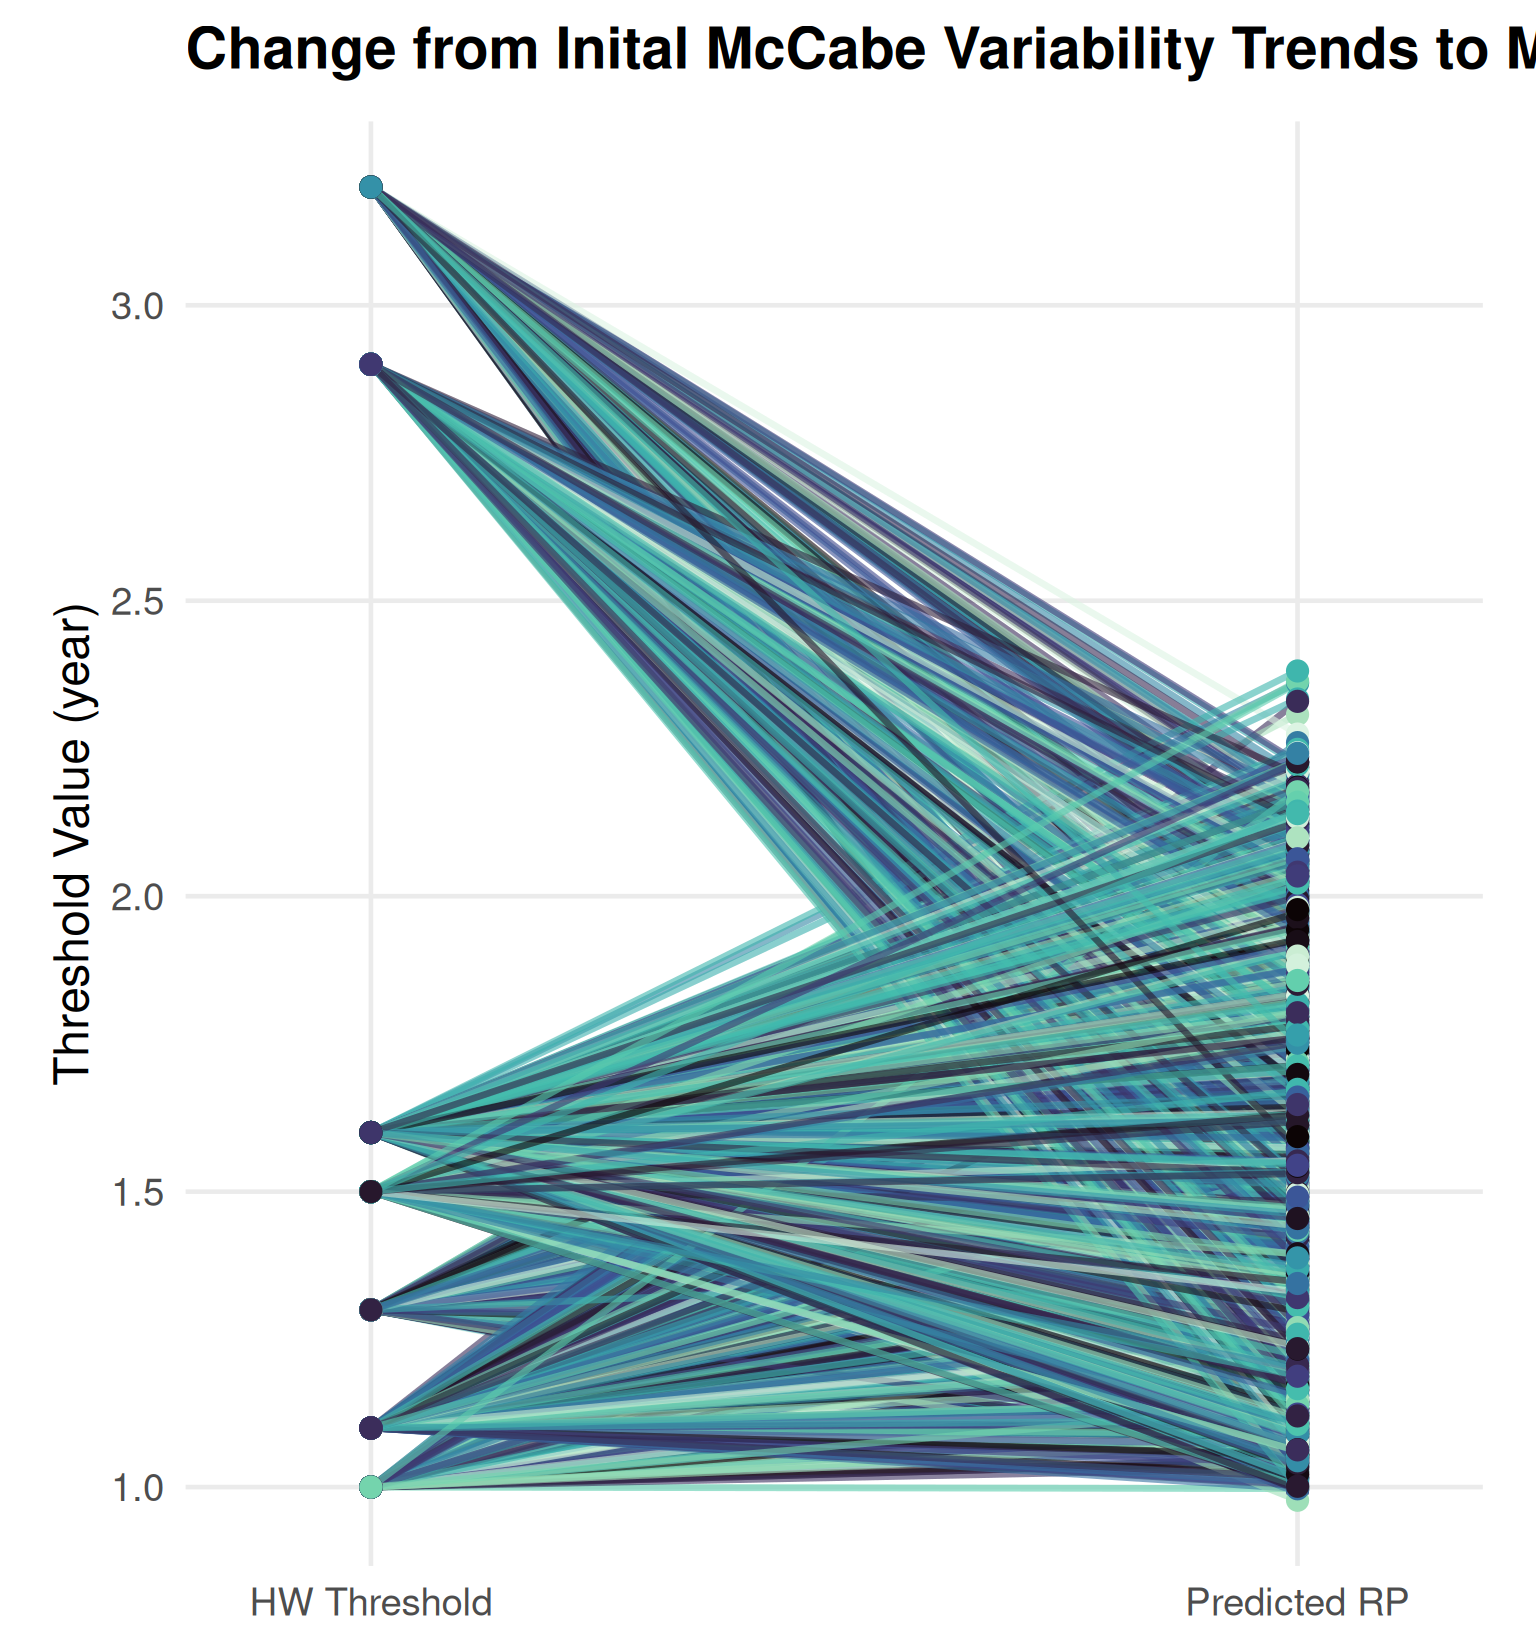
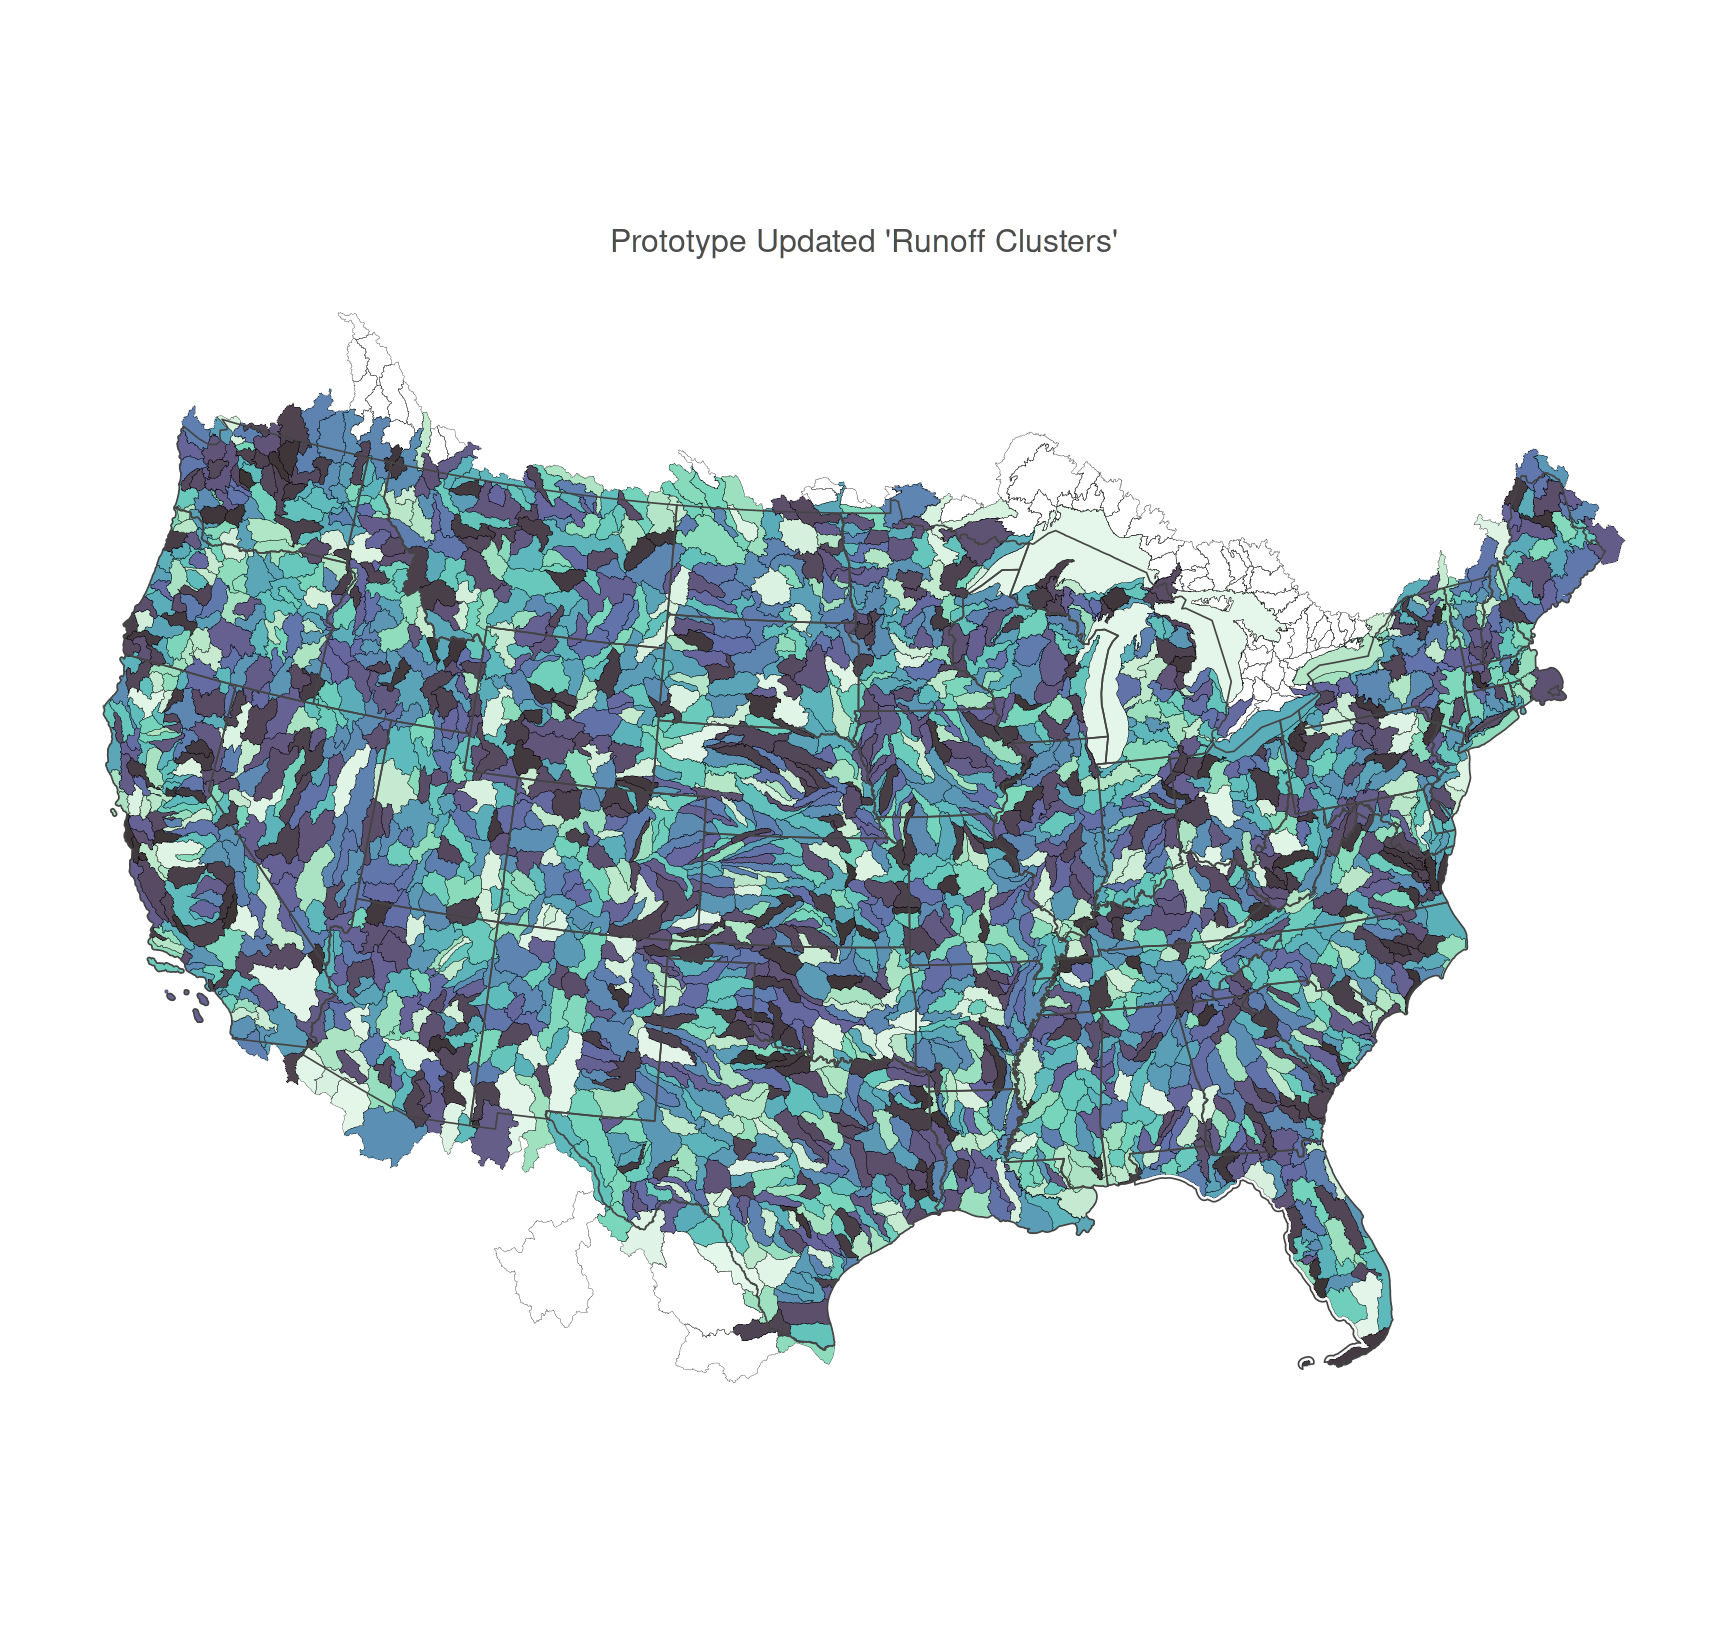
- Runoff efficiency: A clustered dataset established by (McCabe and Wolock (2016)) to group hydrologic units by their runoff variability response. These groupings have been used to create initial High Water Thresholds.
- High Water Threshold (HWT): A return period value treated as conceptually equivalent to the bankfill flow. This discharge based threshold is used to flag reaches for automated FIM visualization, but could also be used to call out an “action” discharge (stage) for emergency response purposes.
- Hydrofabric HWT (H-HWT): a hydrofabric based bankfull discharge that could be used as a drop-in replacement for the current HWT estimate use cases.
- Hydrofabric HWT (H-HWT):
- the
n% AEP for years 1970 to 2020: The preferred terminology that verbosely covers and conveys all the needed information that went into the workflow.
The Before
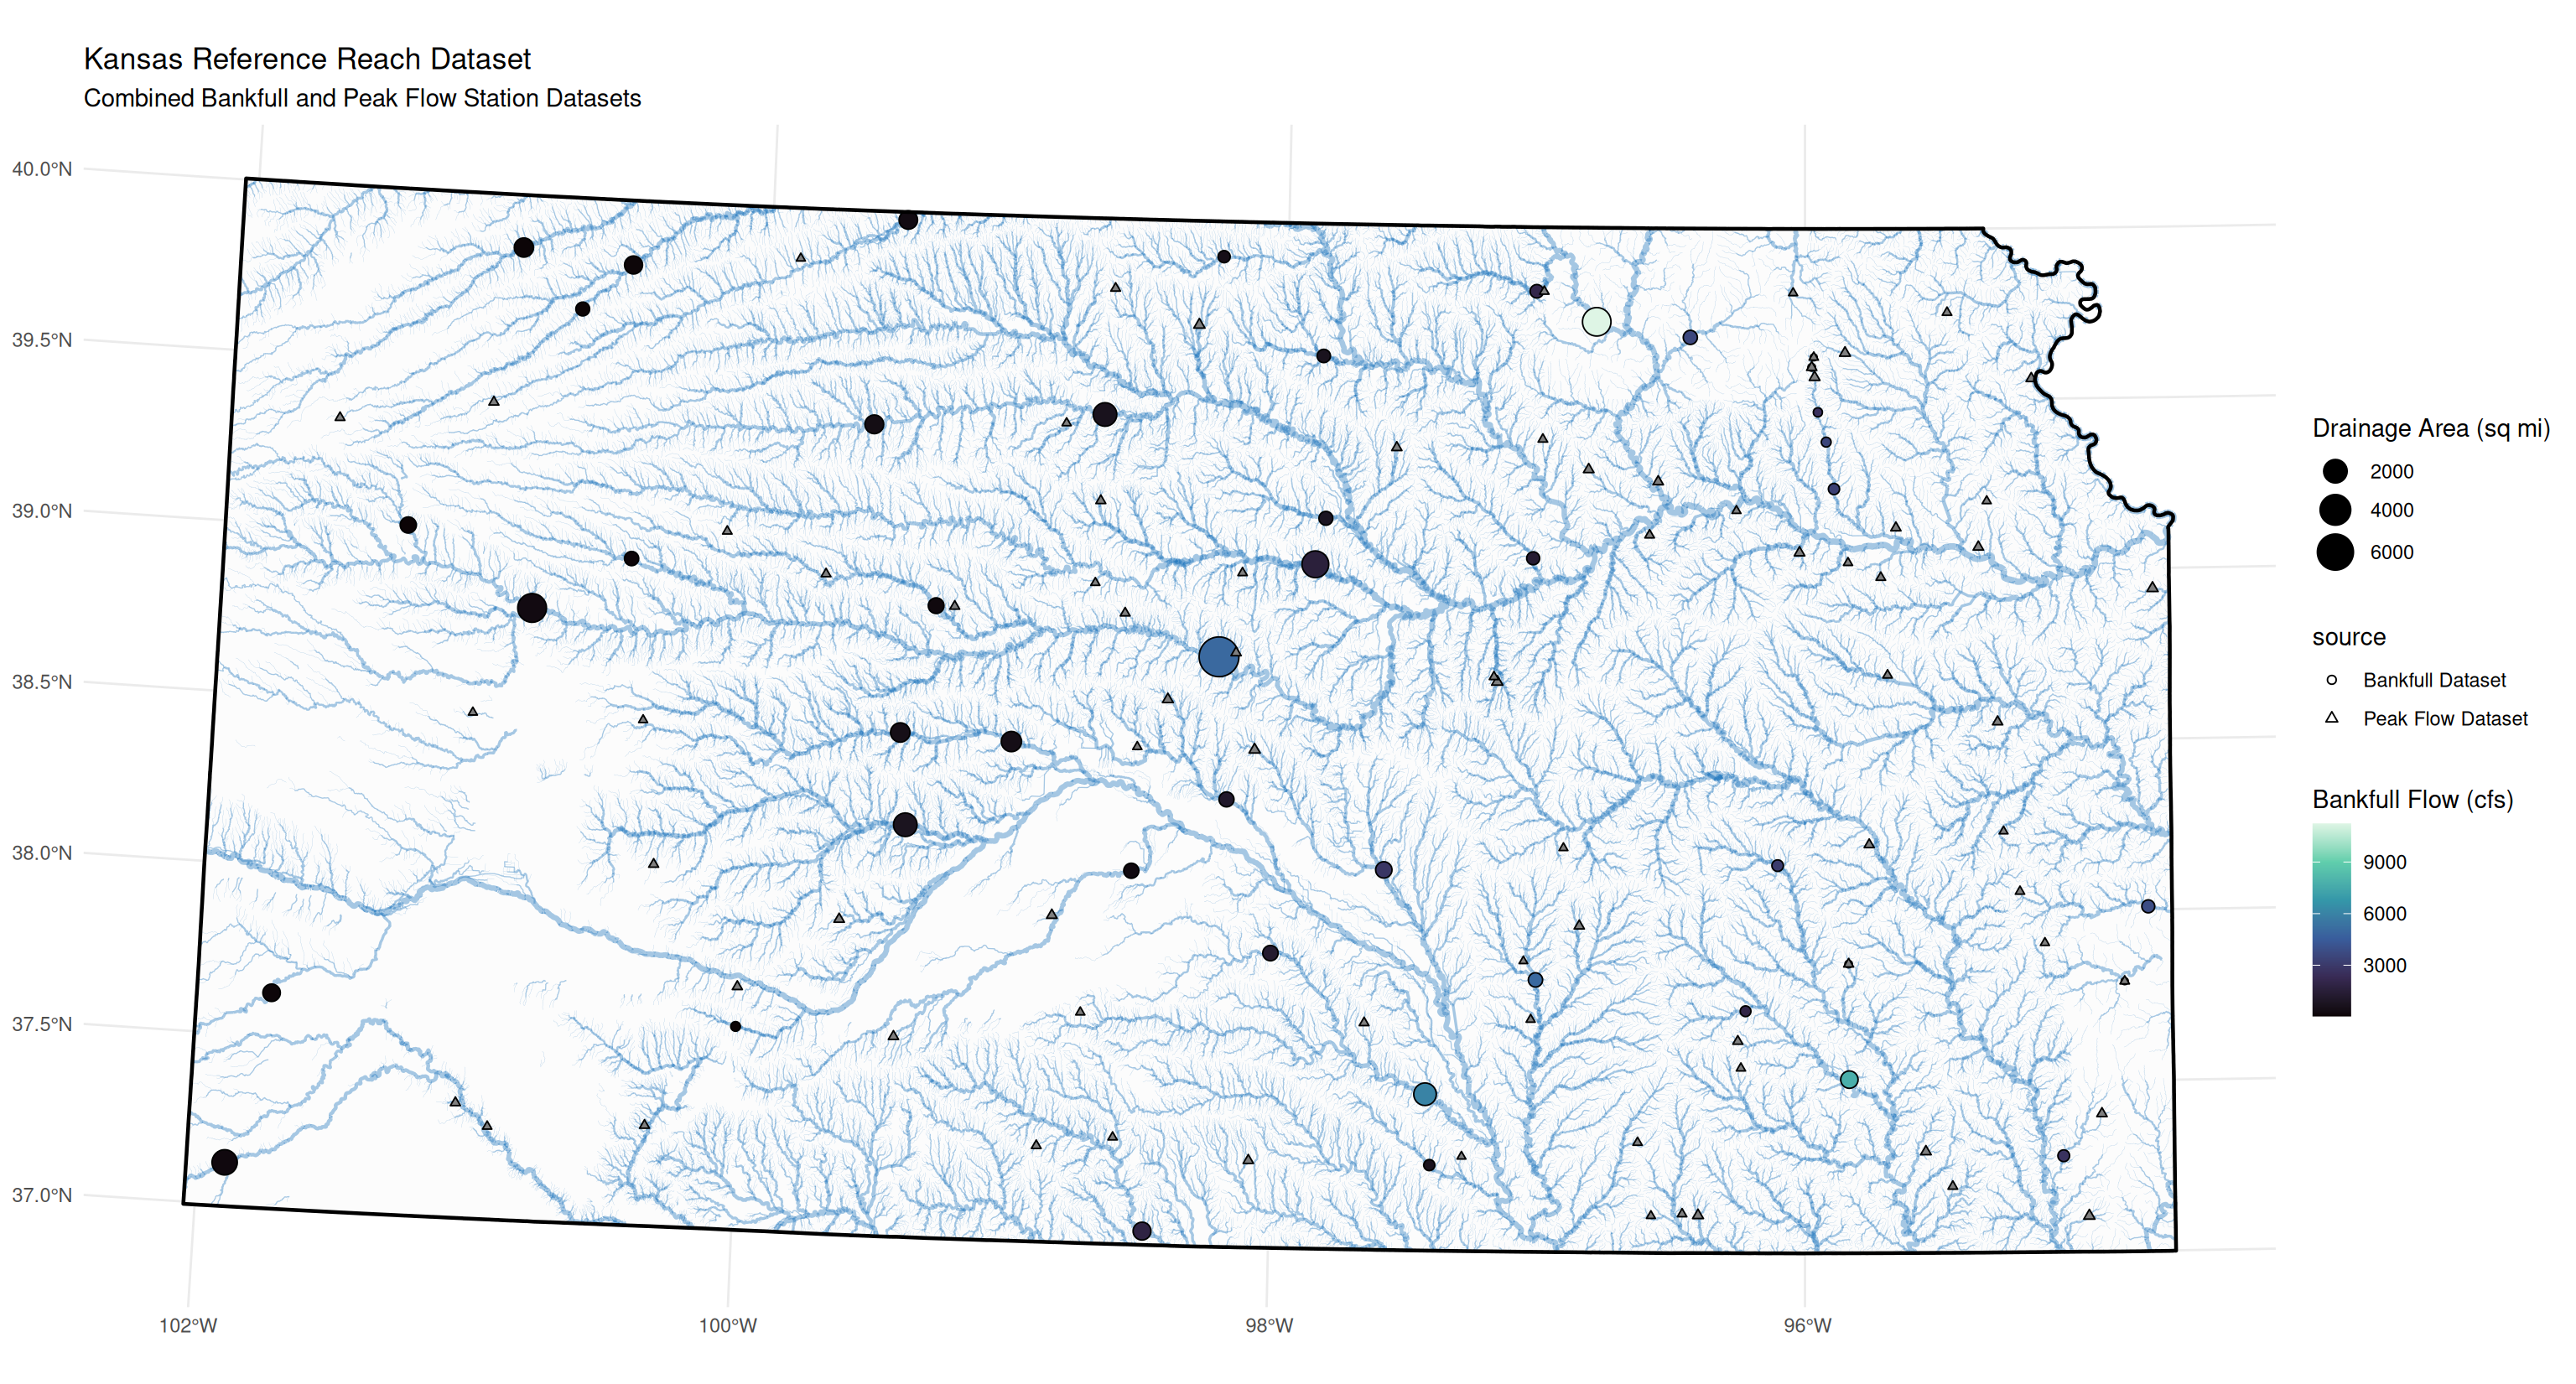
A Novel Dataset
An Aggregate Regression
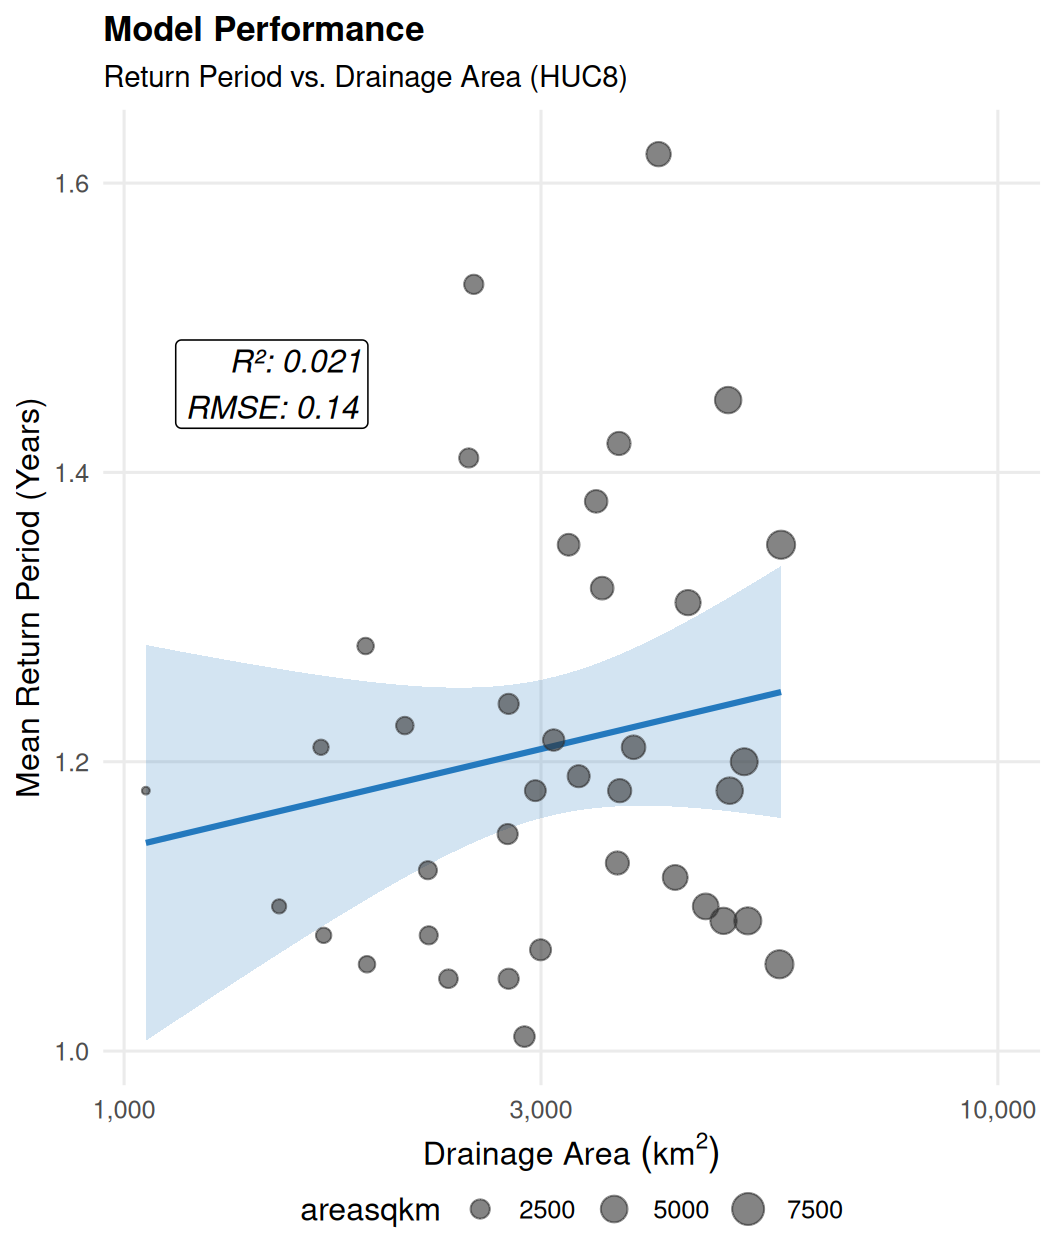
Direct Comparisons
CONUS scale Flows
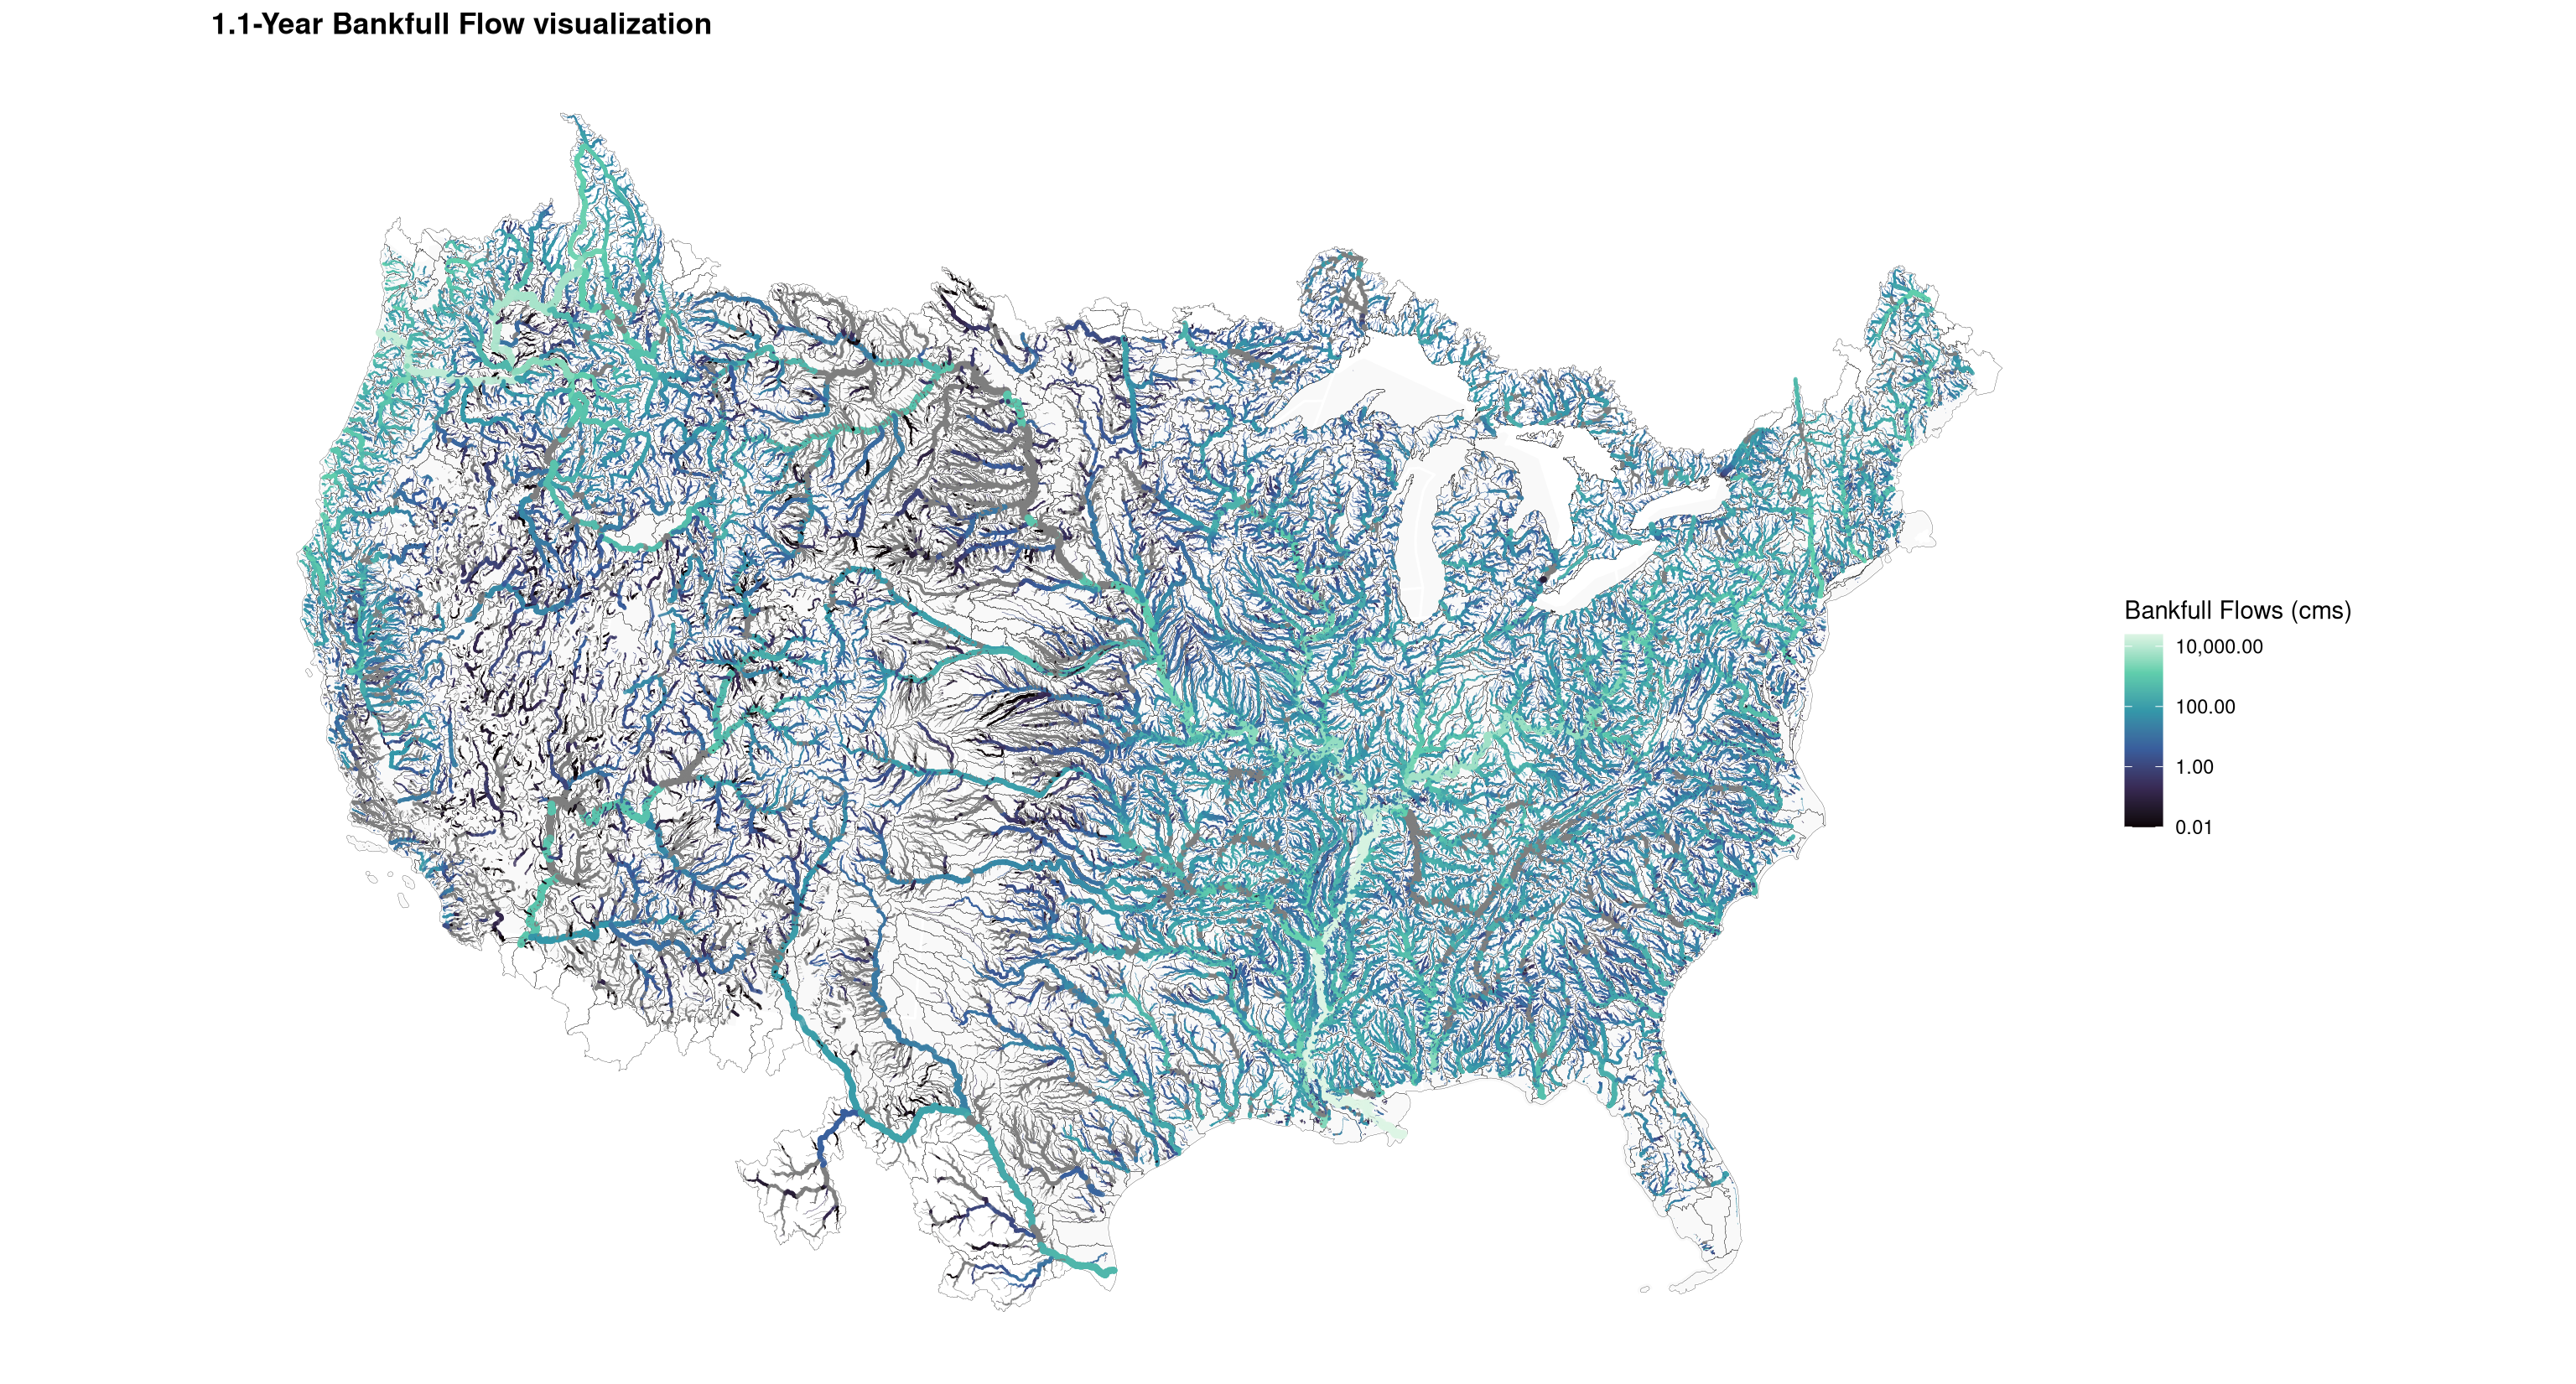
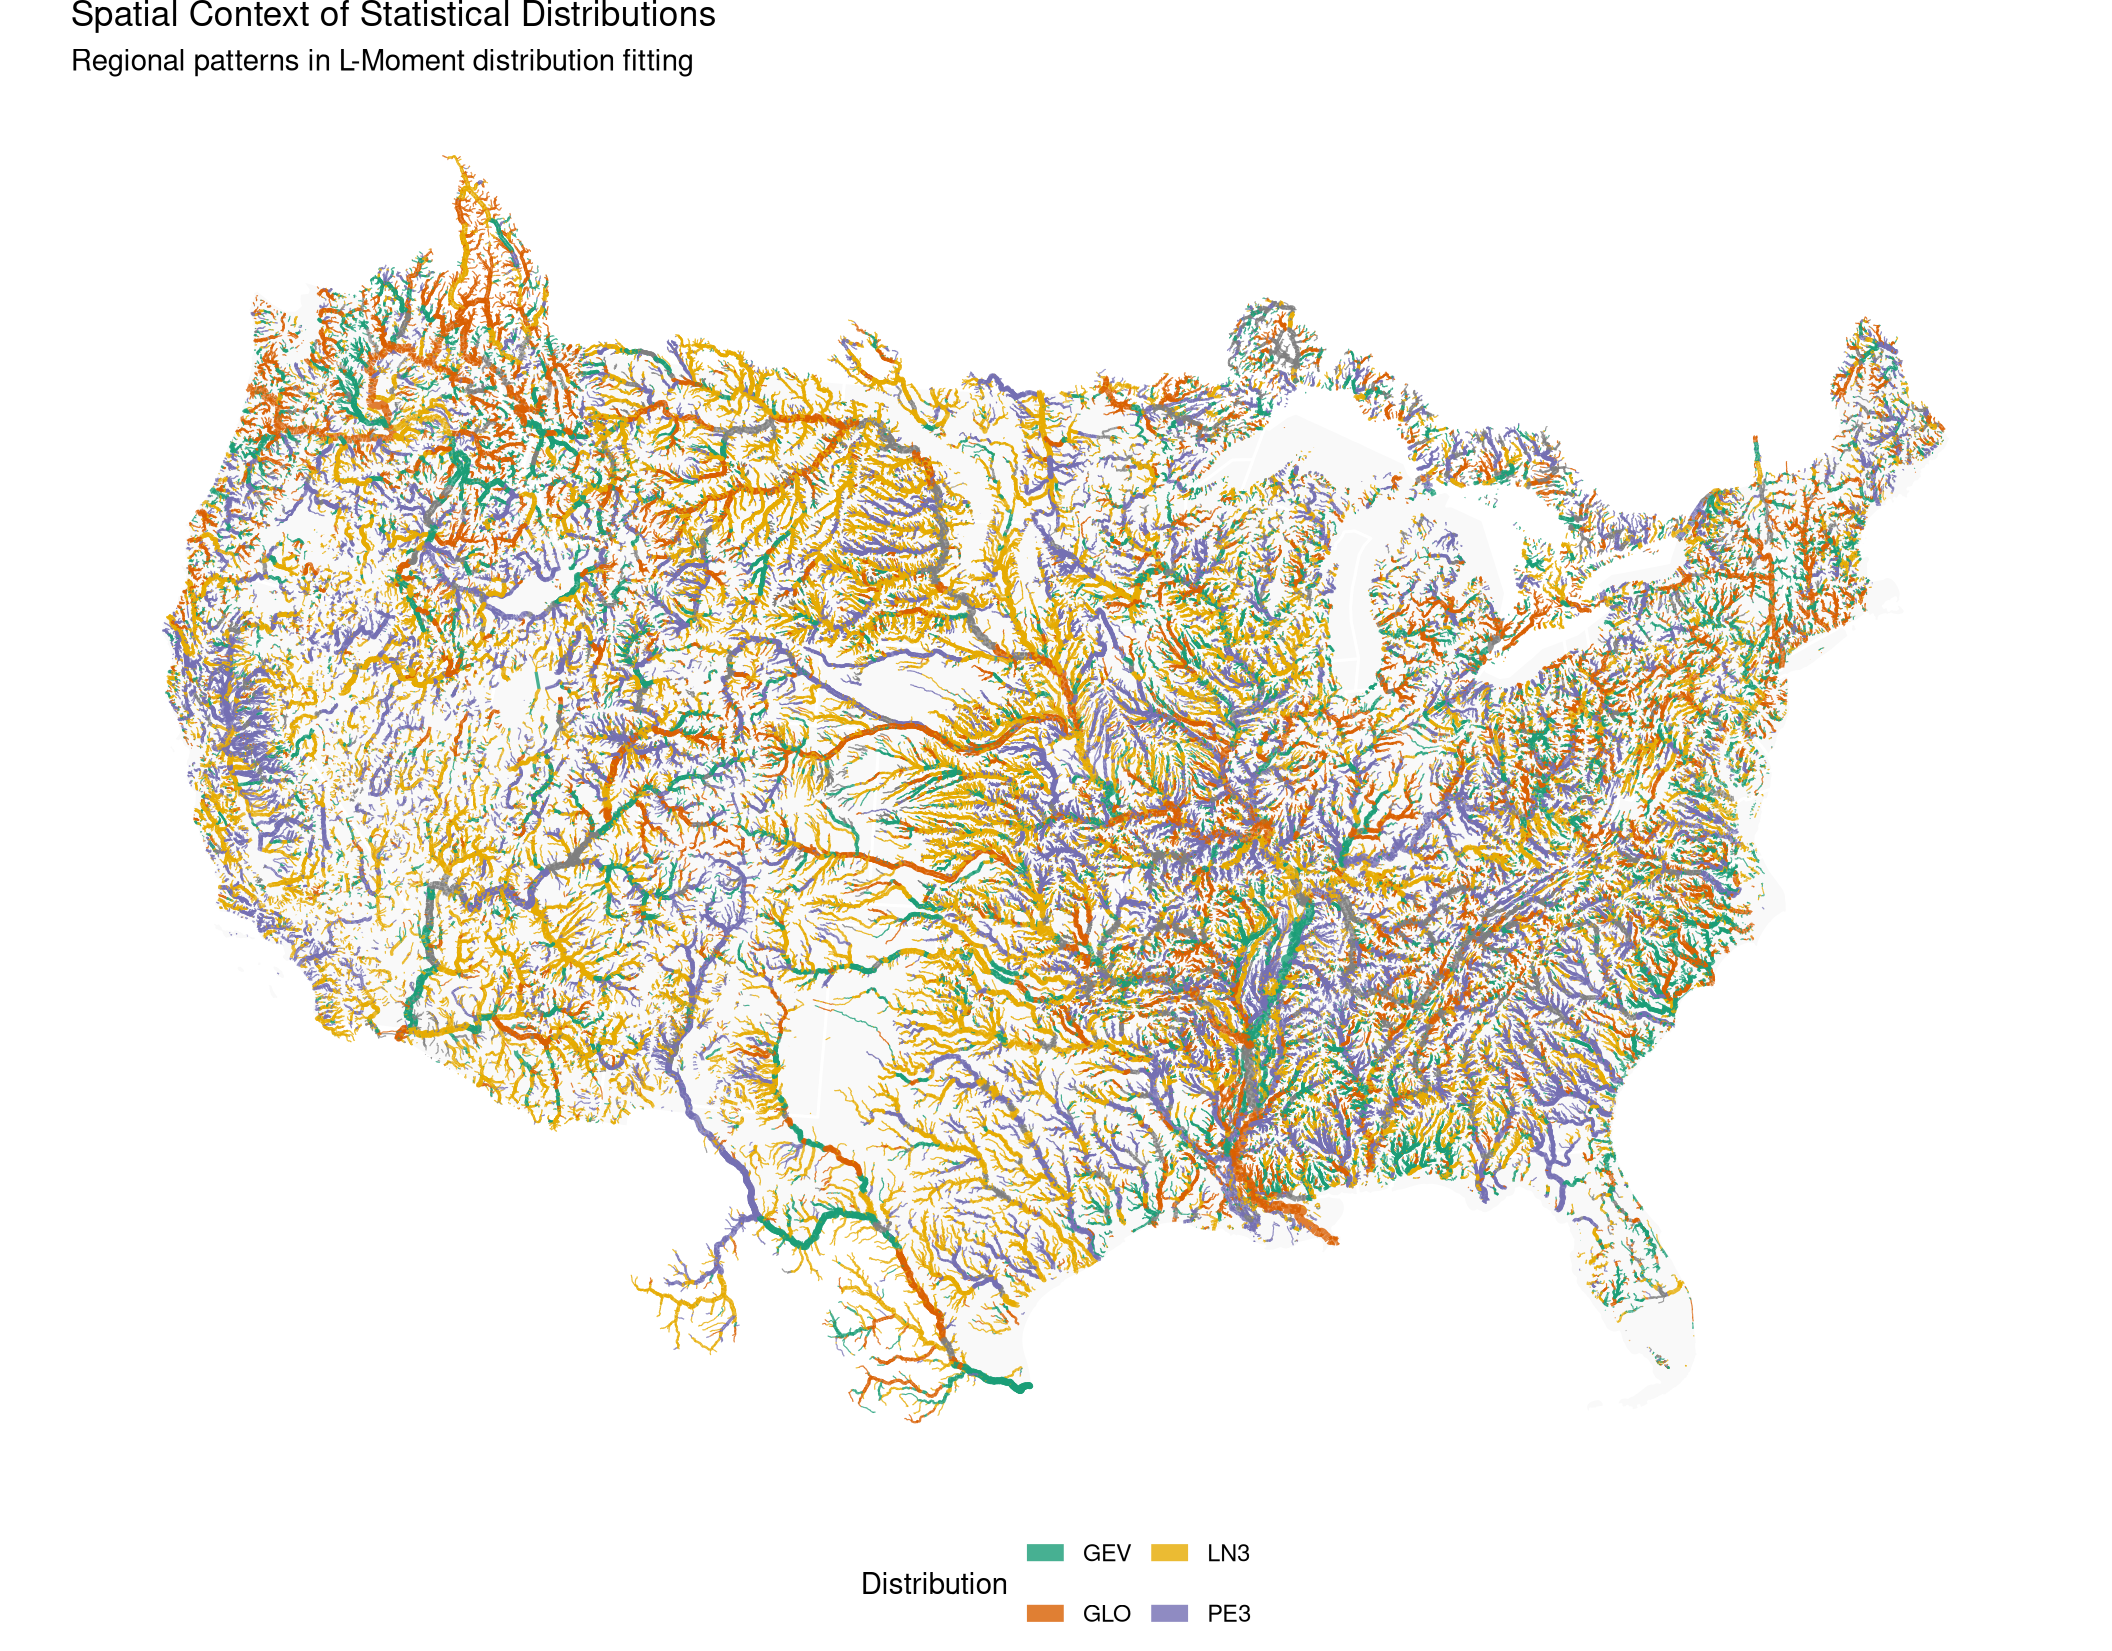
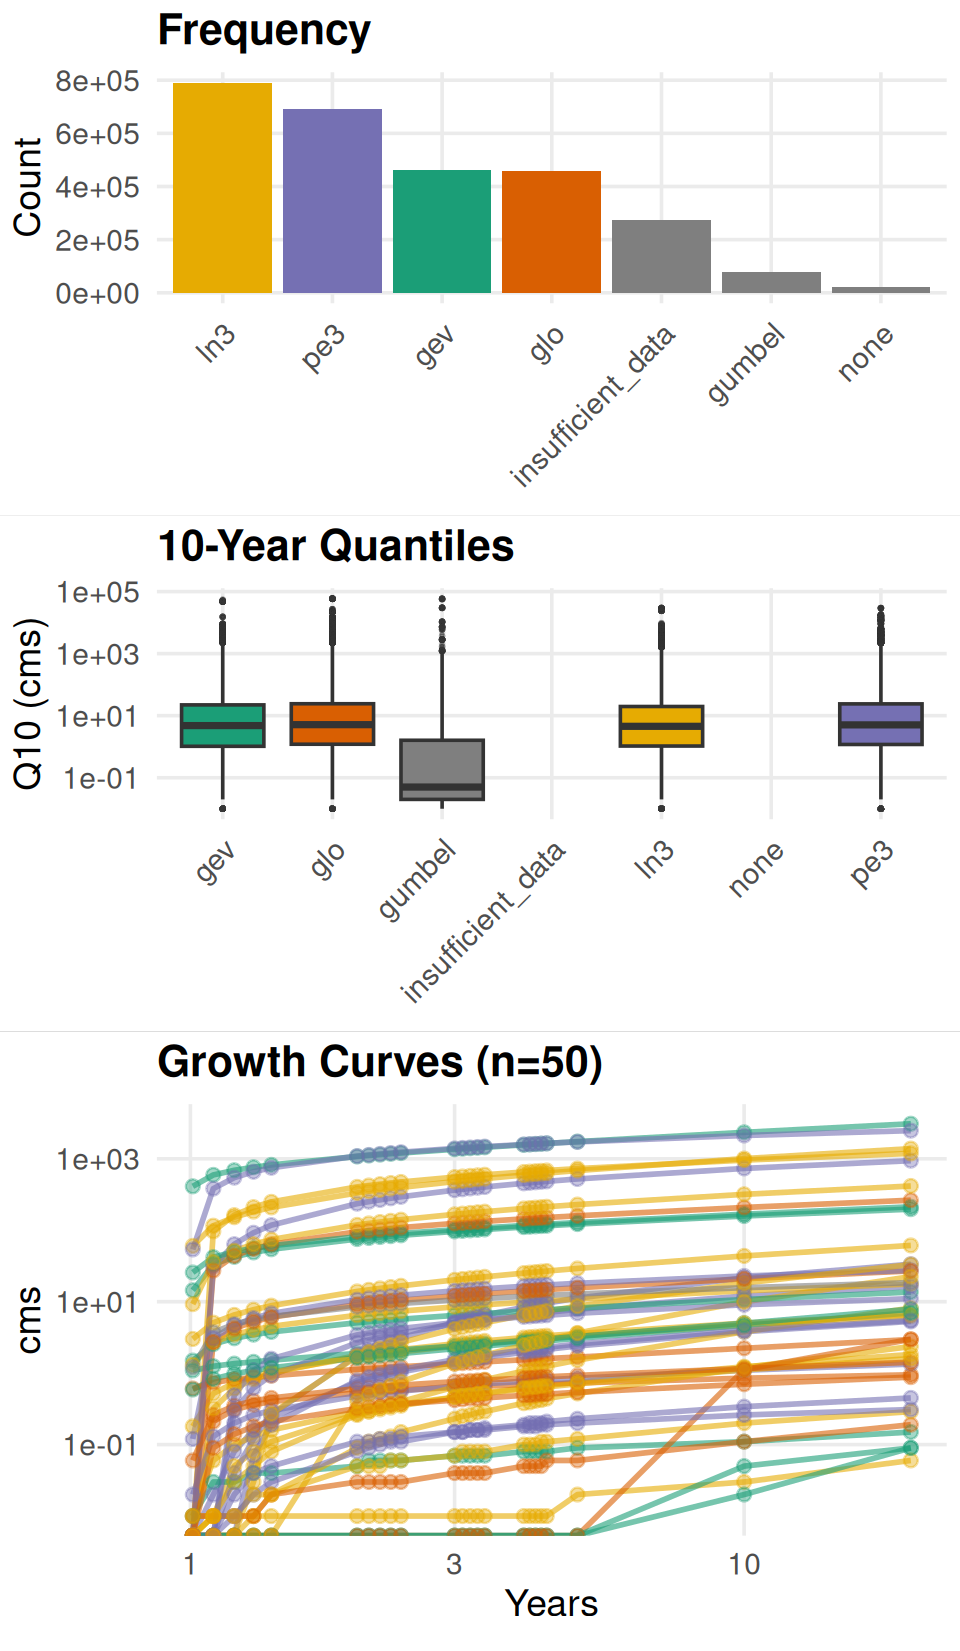
CONUS Scale Distributions
An Informed Starting Point
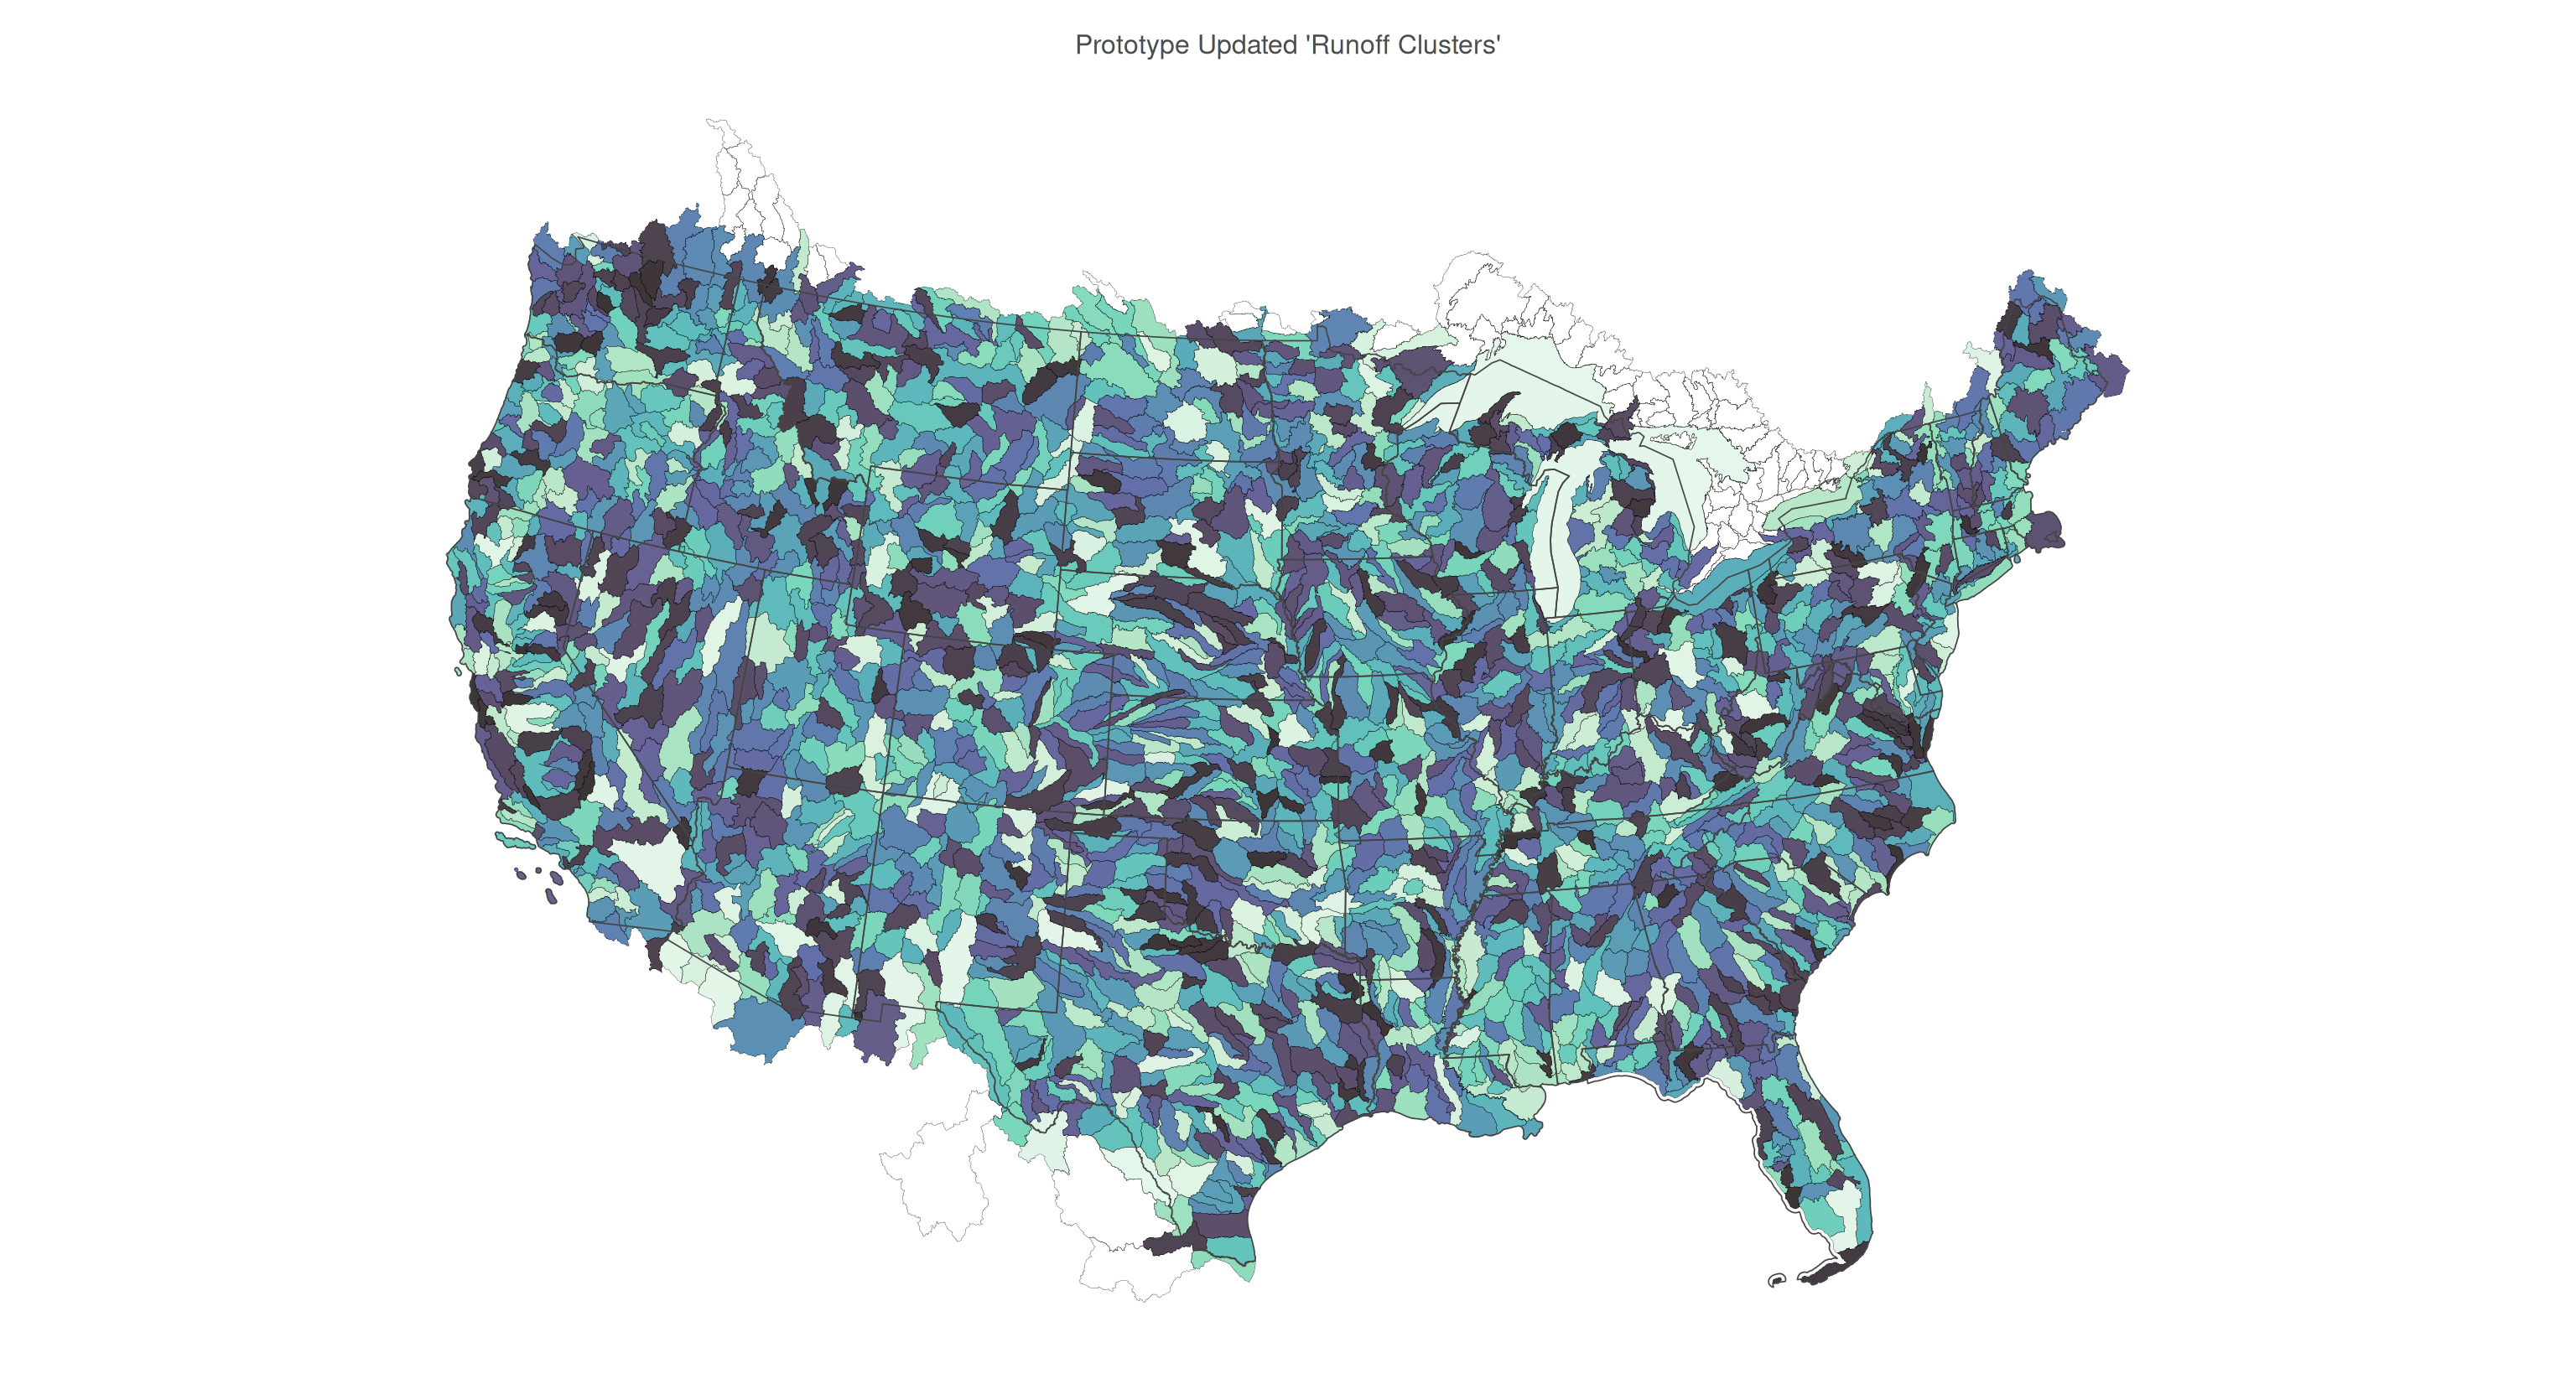
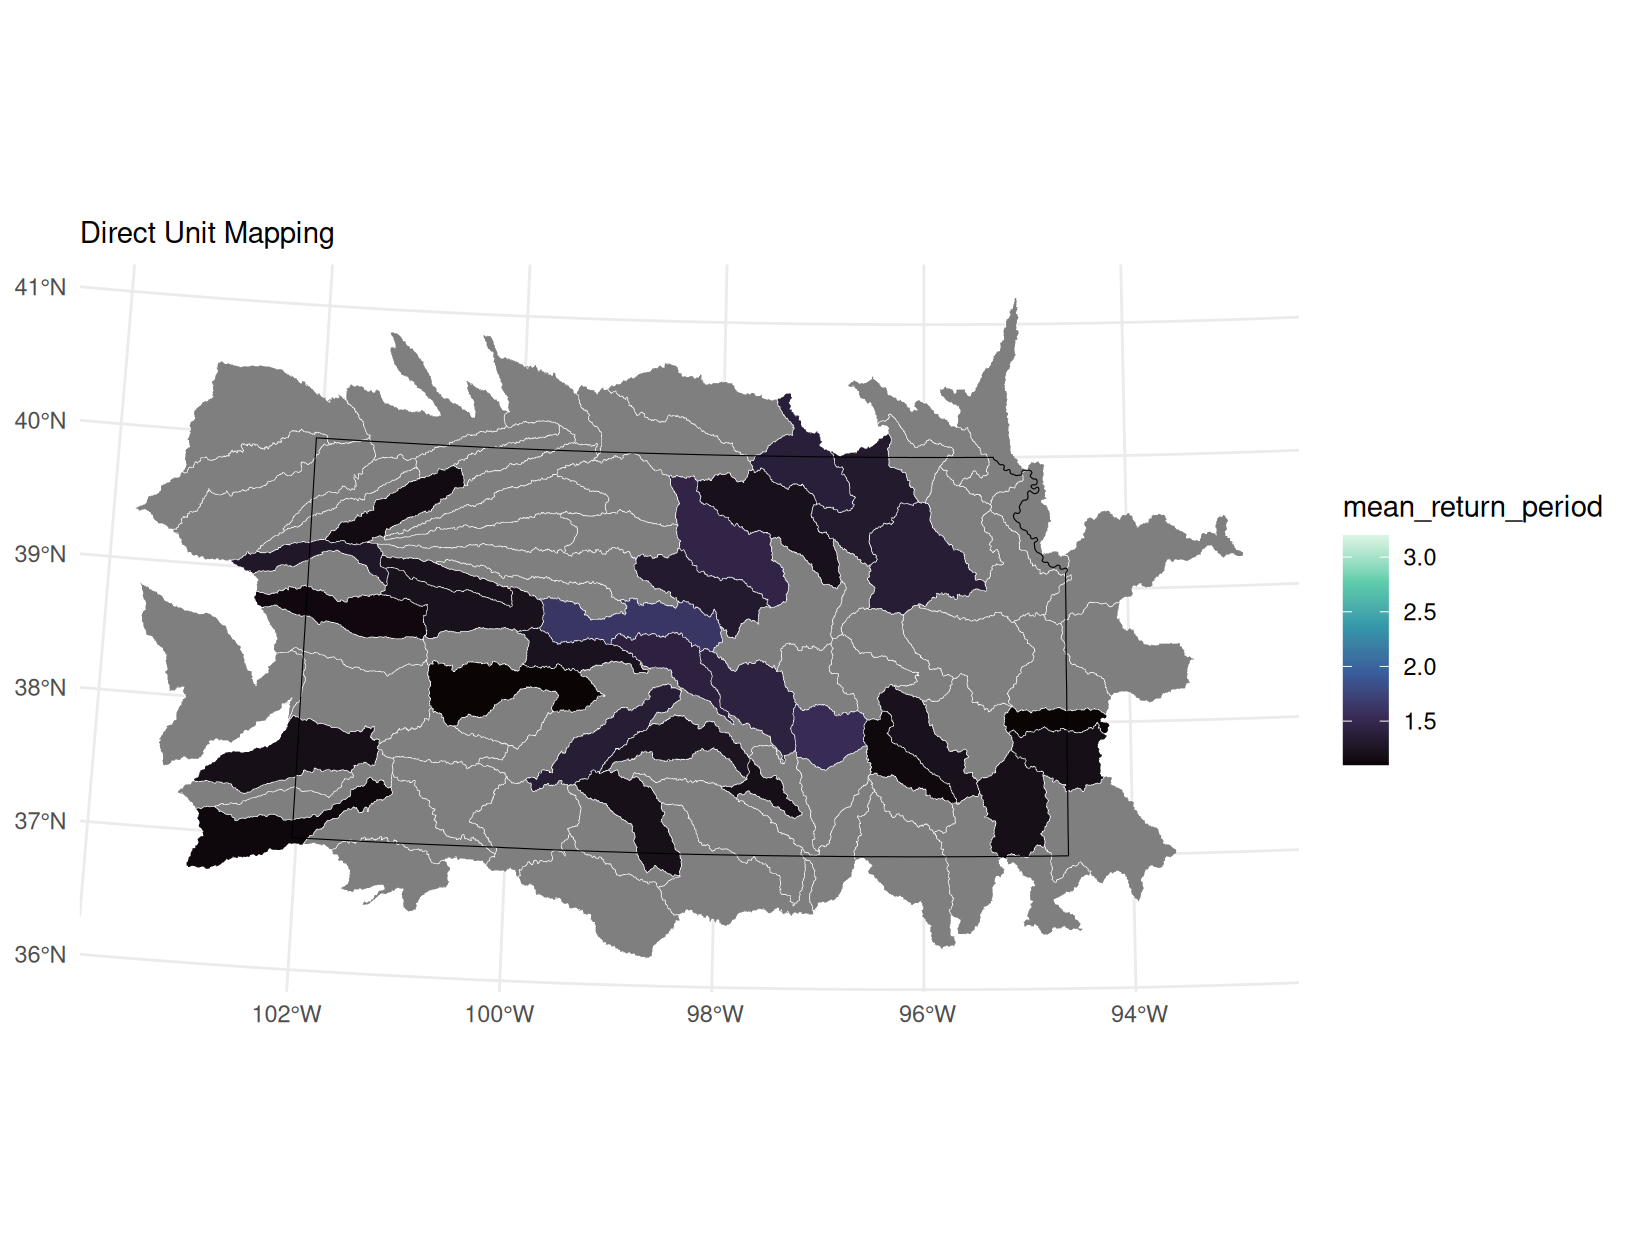
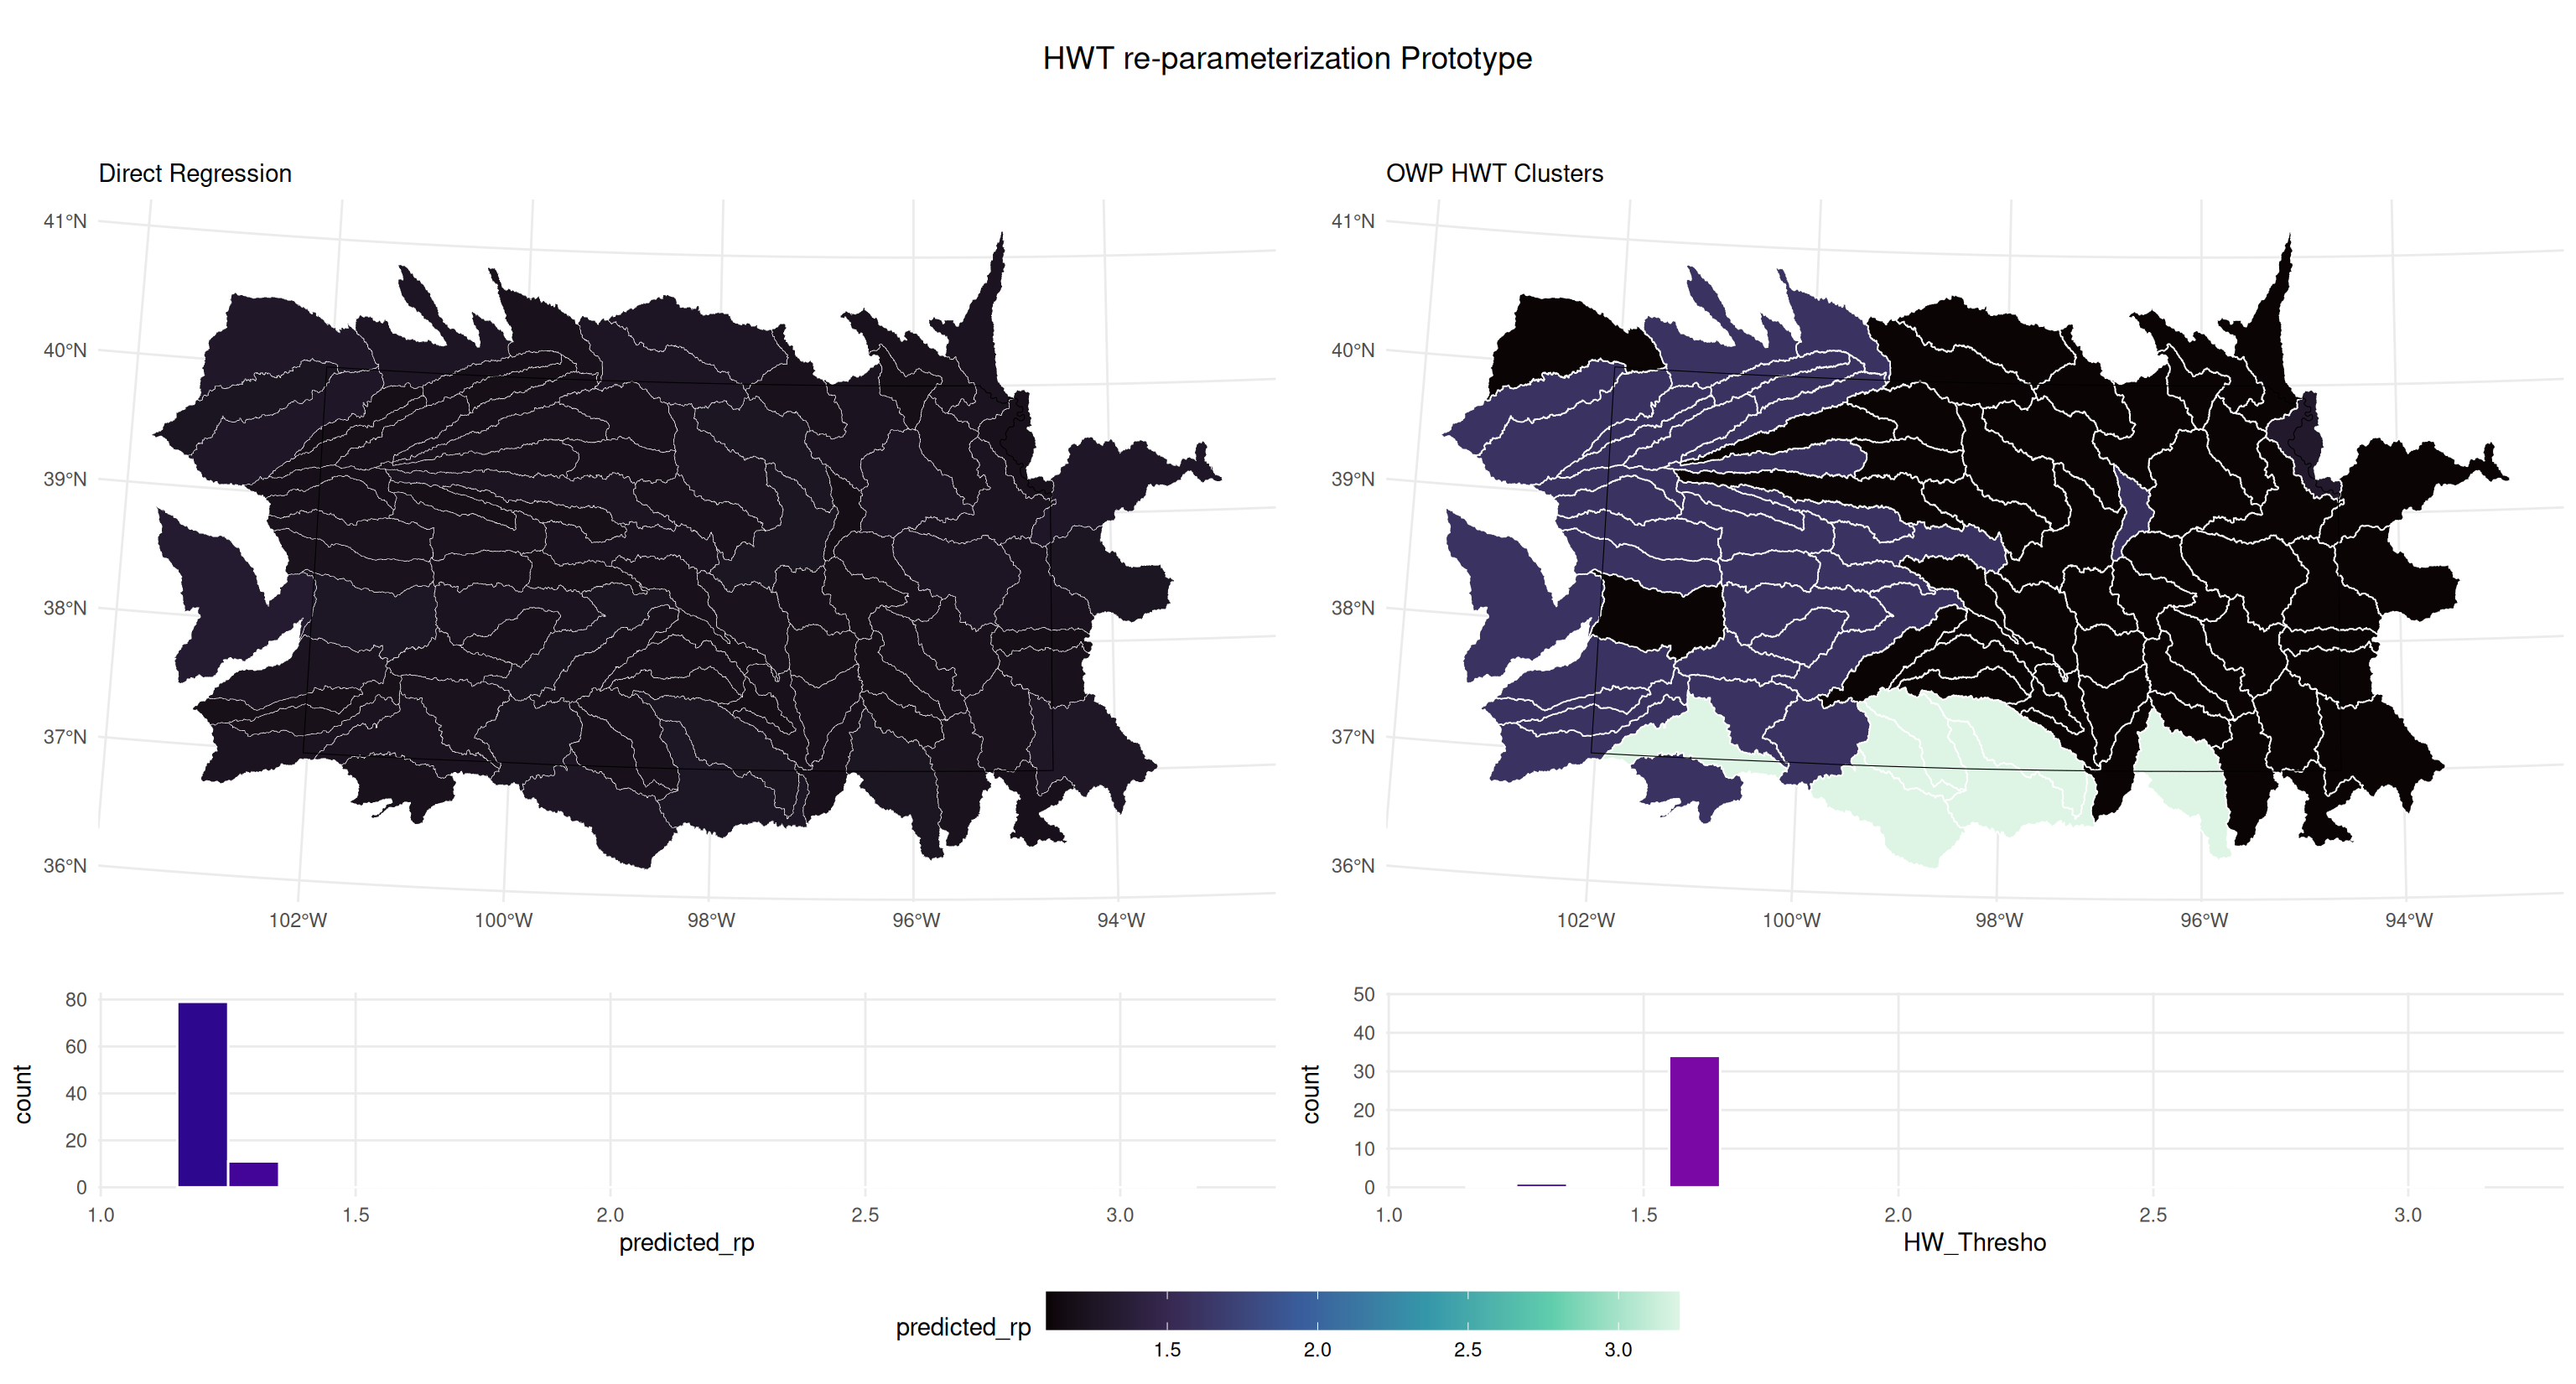
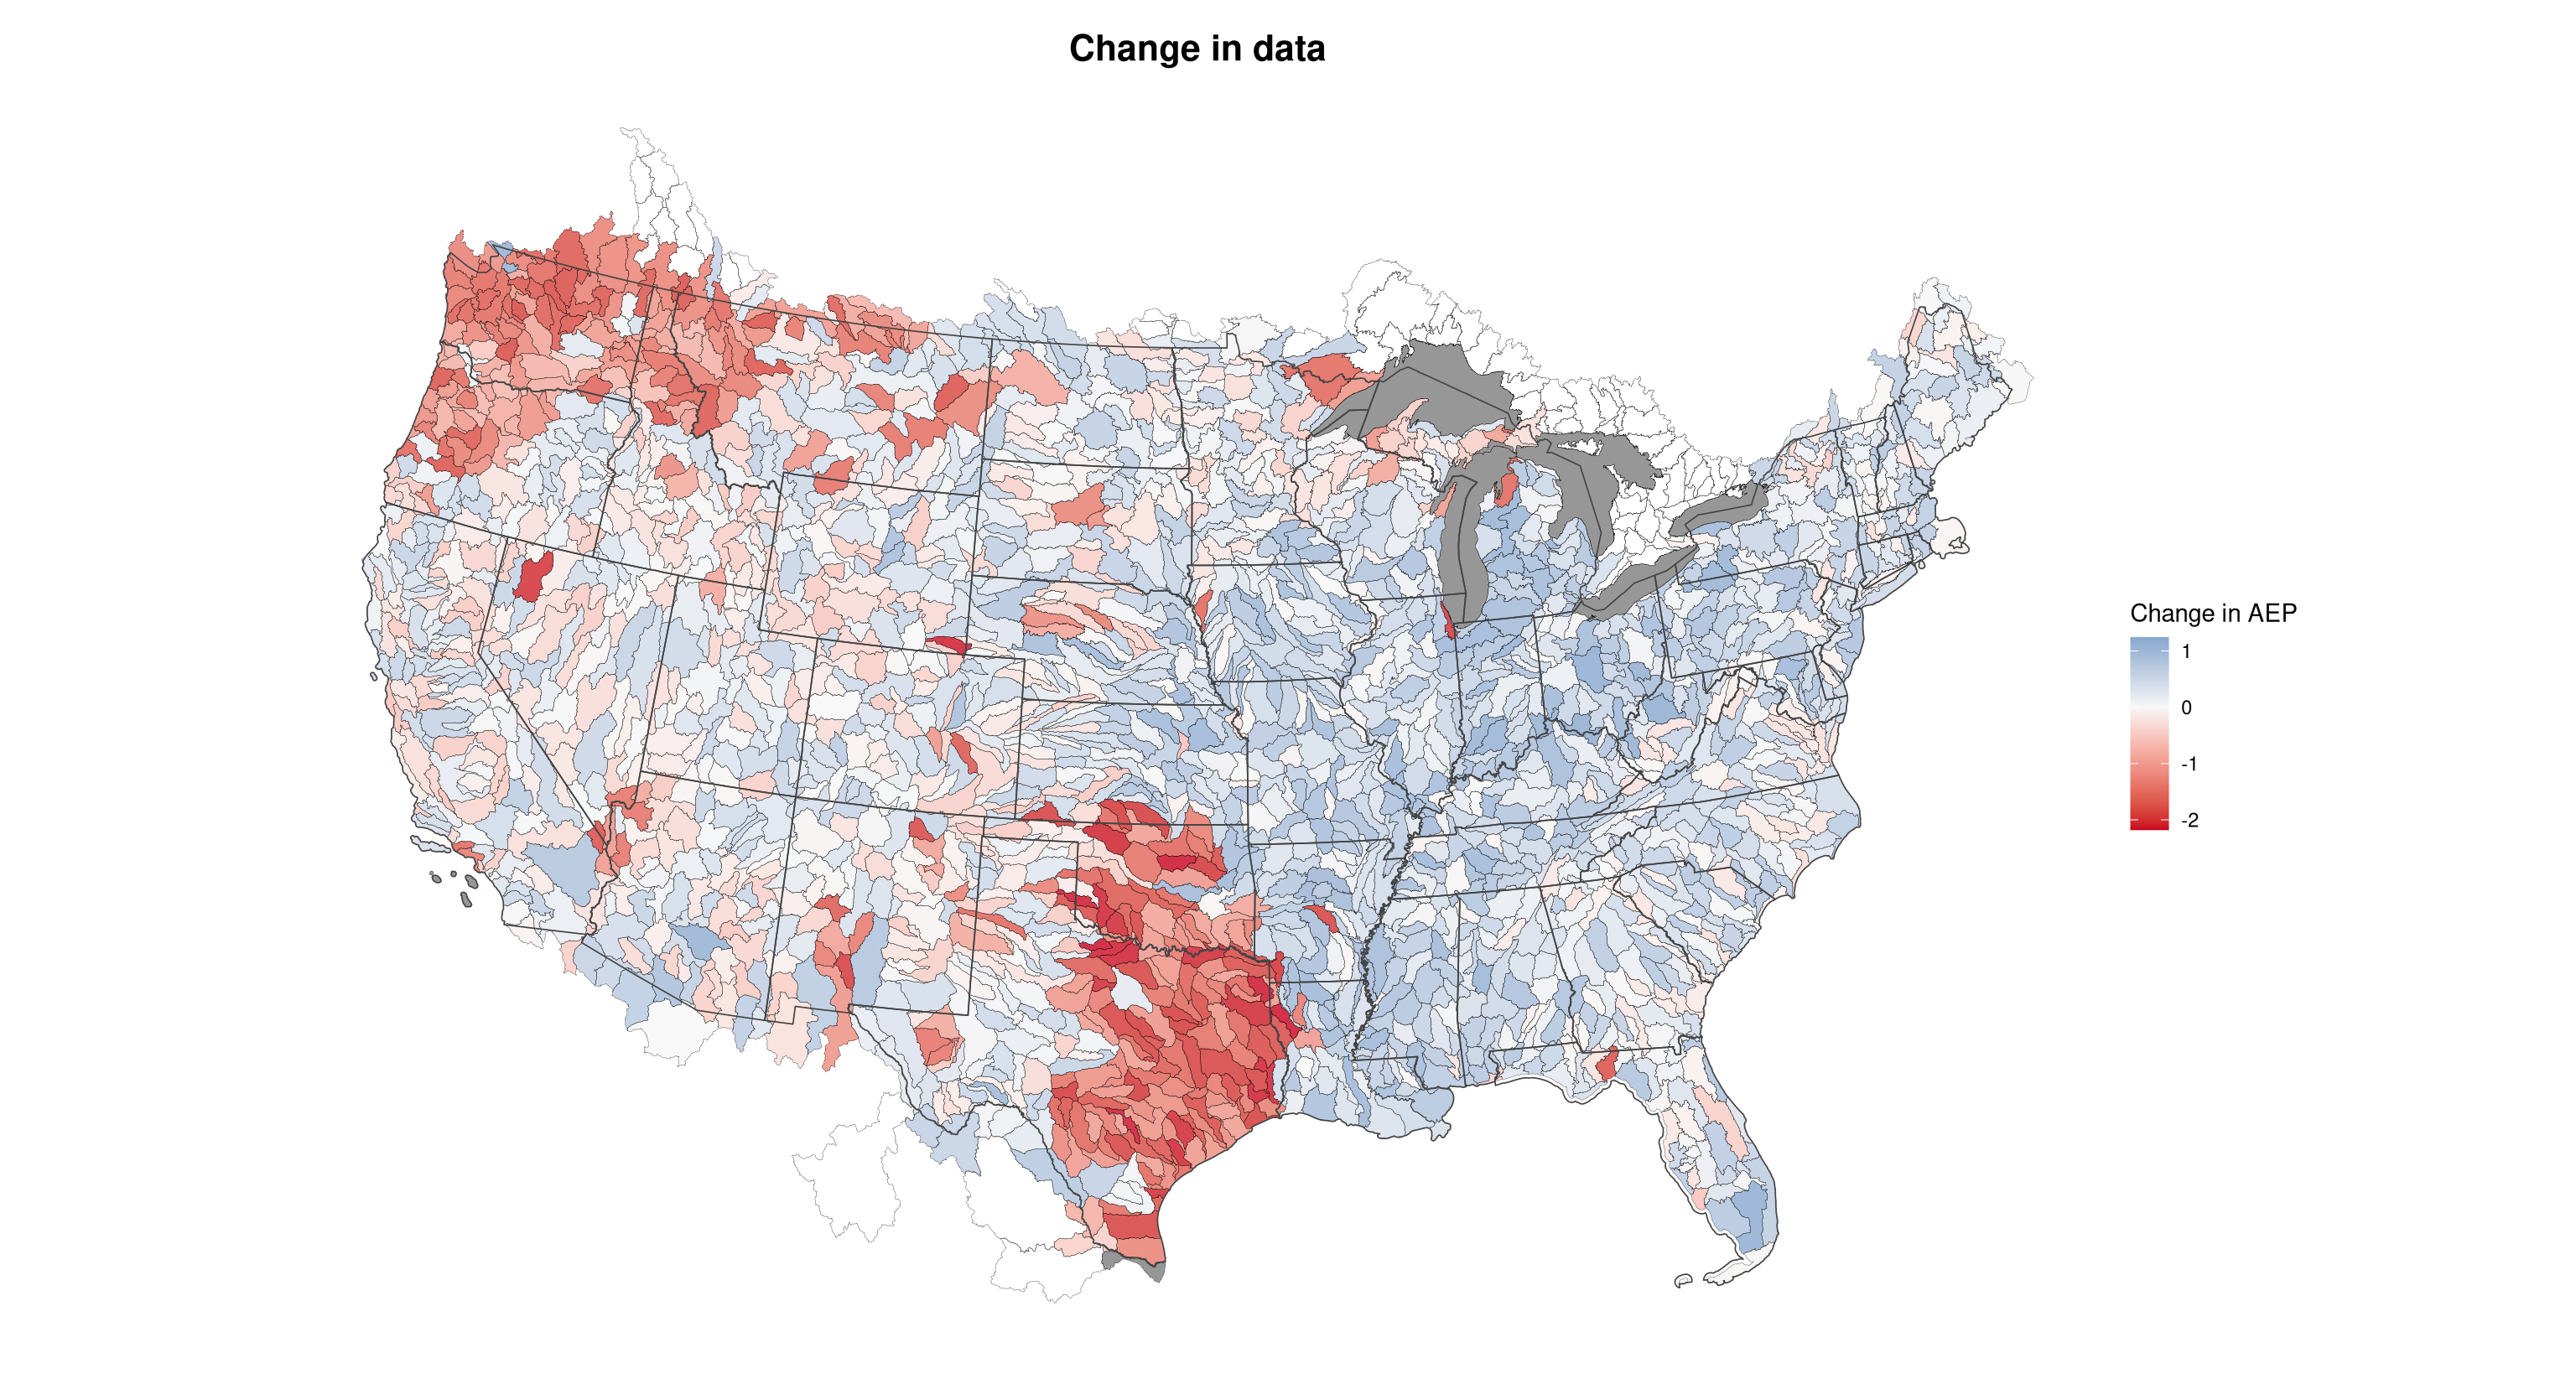
Mapping Changes
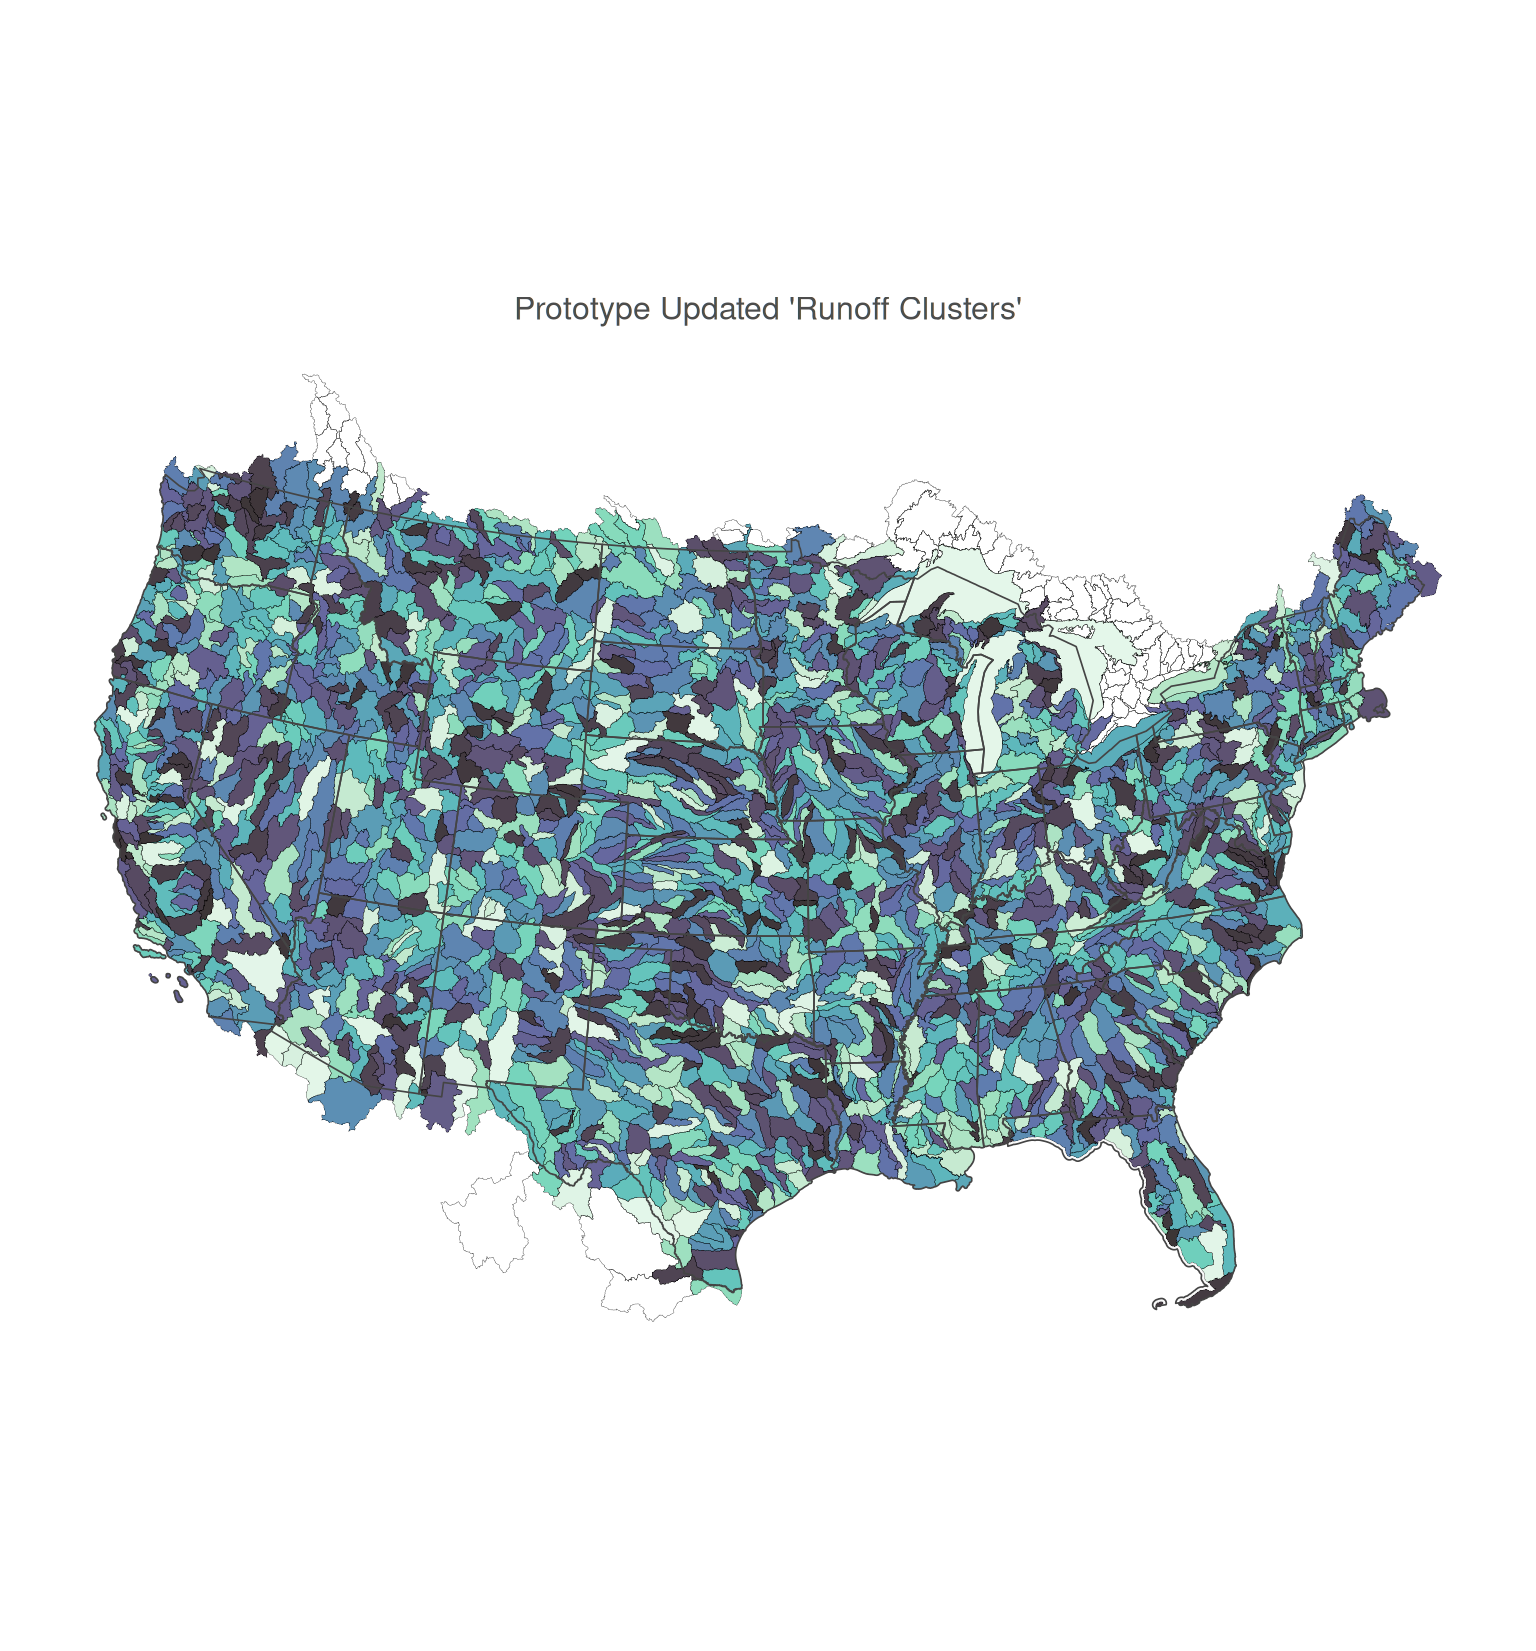
Maps of Change
What’s Next?
Outcomes and Takeaways:
- Return periods at the bankfull flow are a mobile target.
- A prototype dataset
Next Steps:
Sources:
McCabe, Gregory J., and David M. Wolock. 2016. “Variability and Trends in Runoff Efficiency in the Conterminous United States.” JAWRA Journal of the American Water Resources Association 52 (5): 1046–55. https://doi.org/10.1111/1752-1688.12431.
Shelley, John Edwin. 2012. “Geomorphic Equations and Methods for Natural Channel Design.” PhD thesis, University of Kansas.