TEAM
Executive Summary
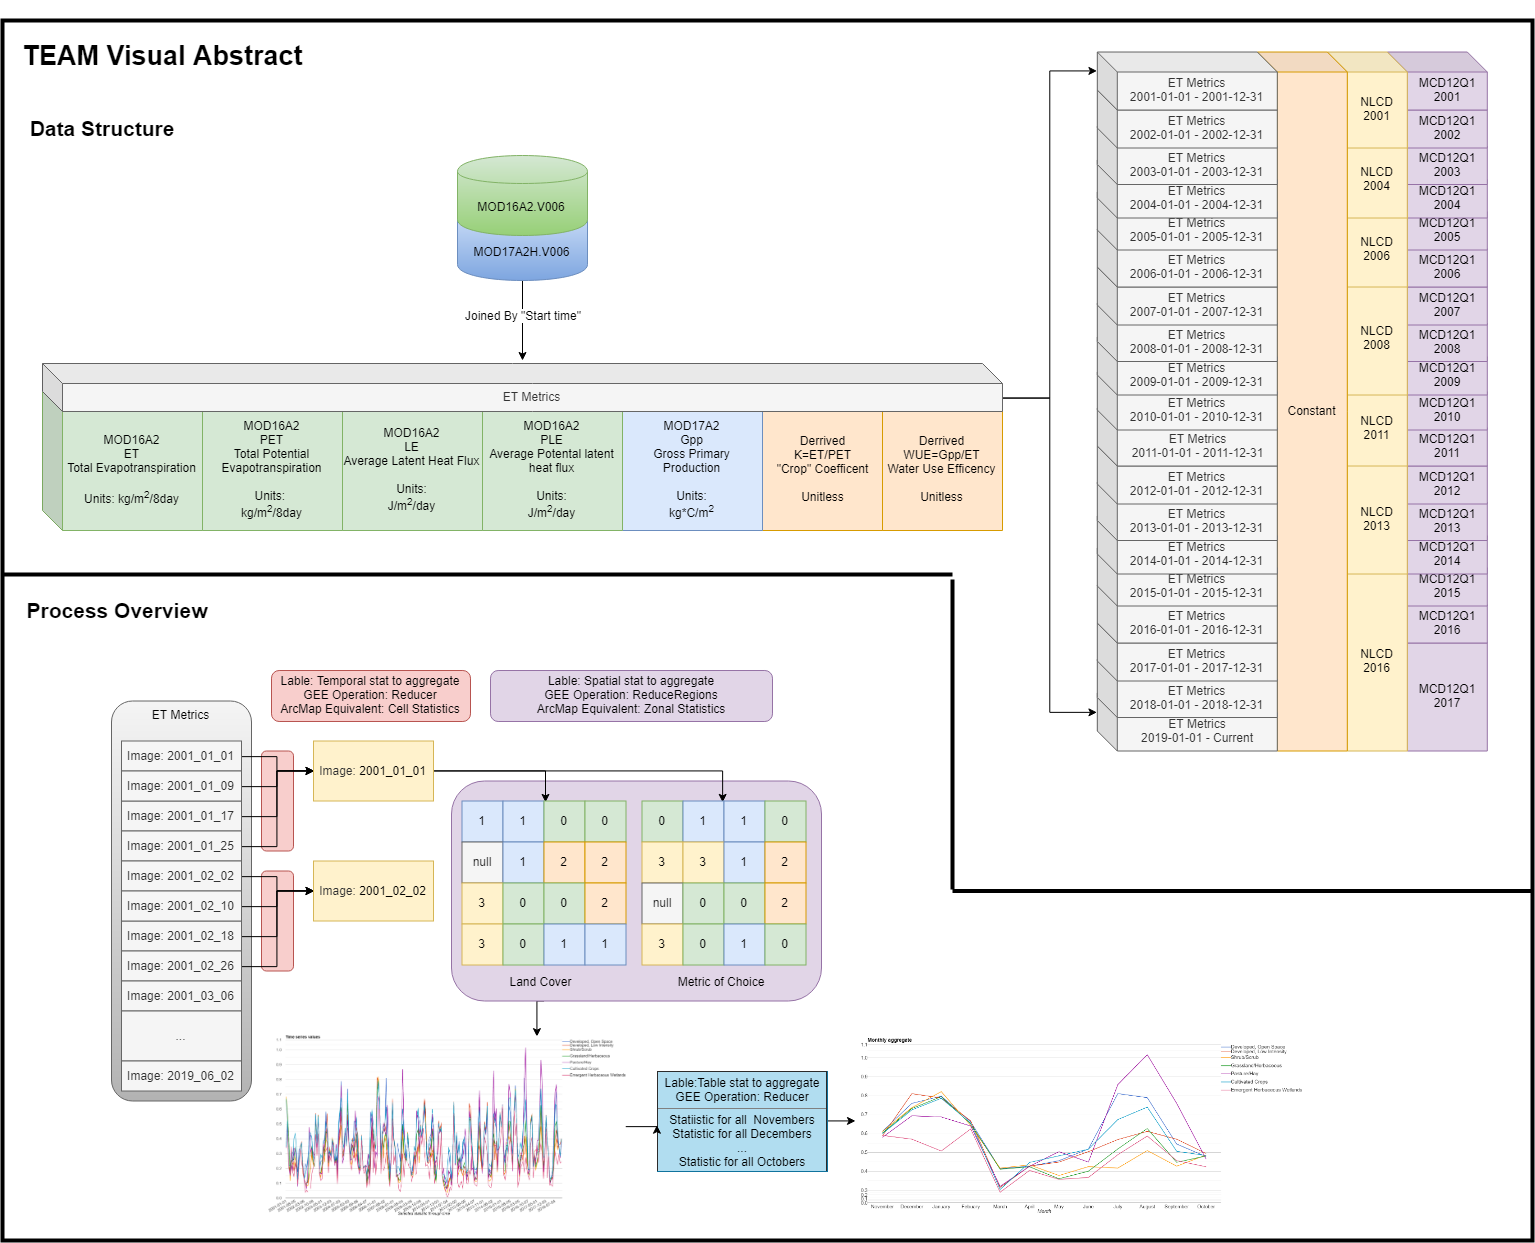
Geographic context and seamless access to key environmental water cycling metrics is a fairly well defined operation with a massive amount of technical and digital friction associated with it. Recently, Google Earth Engine has added the ability to create UI features to the platform, creation seamless experience between data, processing, and presentation a “one stop shop, from observation to presentation”. This is an exploration of the methods and structure of that feature to more readily address what I feel are embarrassingly easy questions to pose, but an embarrassingly underwhelming capacity to quickly respond to. To do this, I’ve implemented a GUI driven, zonal statistics equivalent over a gap filled and value added evapotranspiration dataset using the MOD16 and MOD17 products. Go use the application.
Reference
A GEE booth presentation, CUAHSI presentation, and related Hydroshare artifacts.