Data Realizations
public
The analog world is difficult to express in digital terms, but we’ll try to anyways
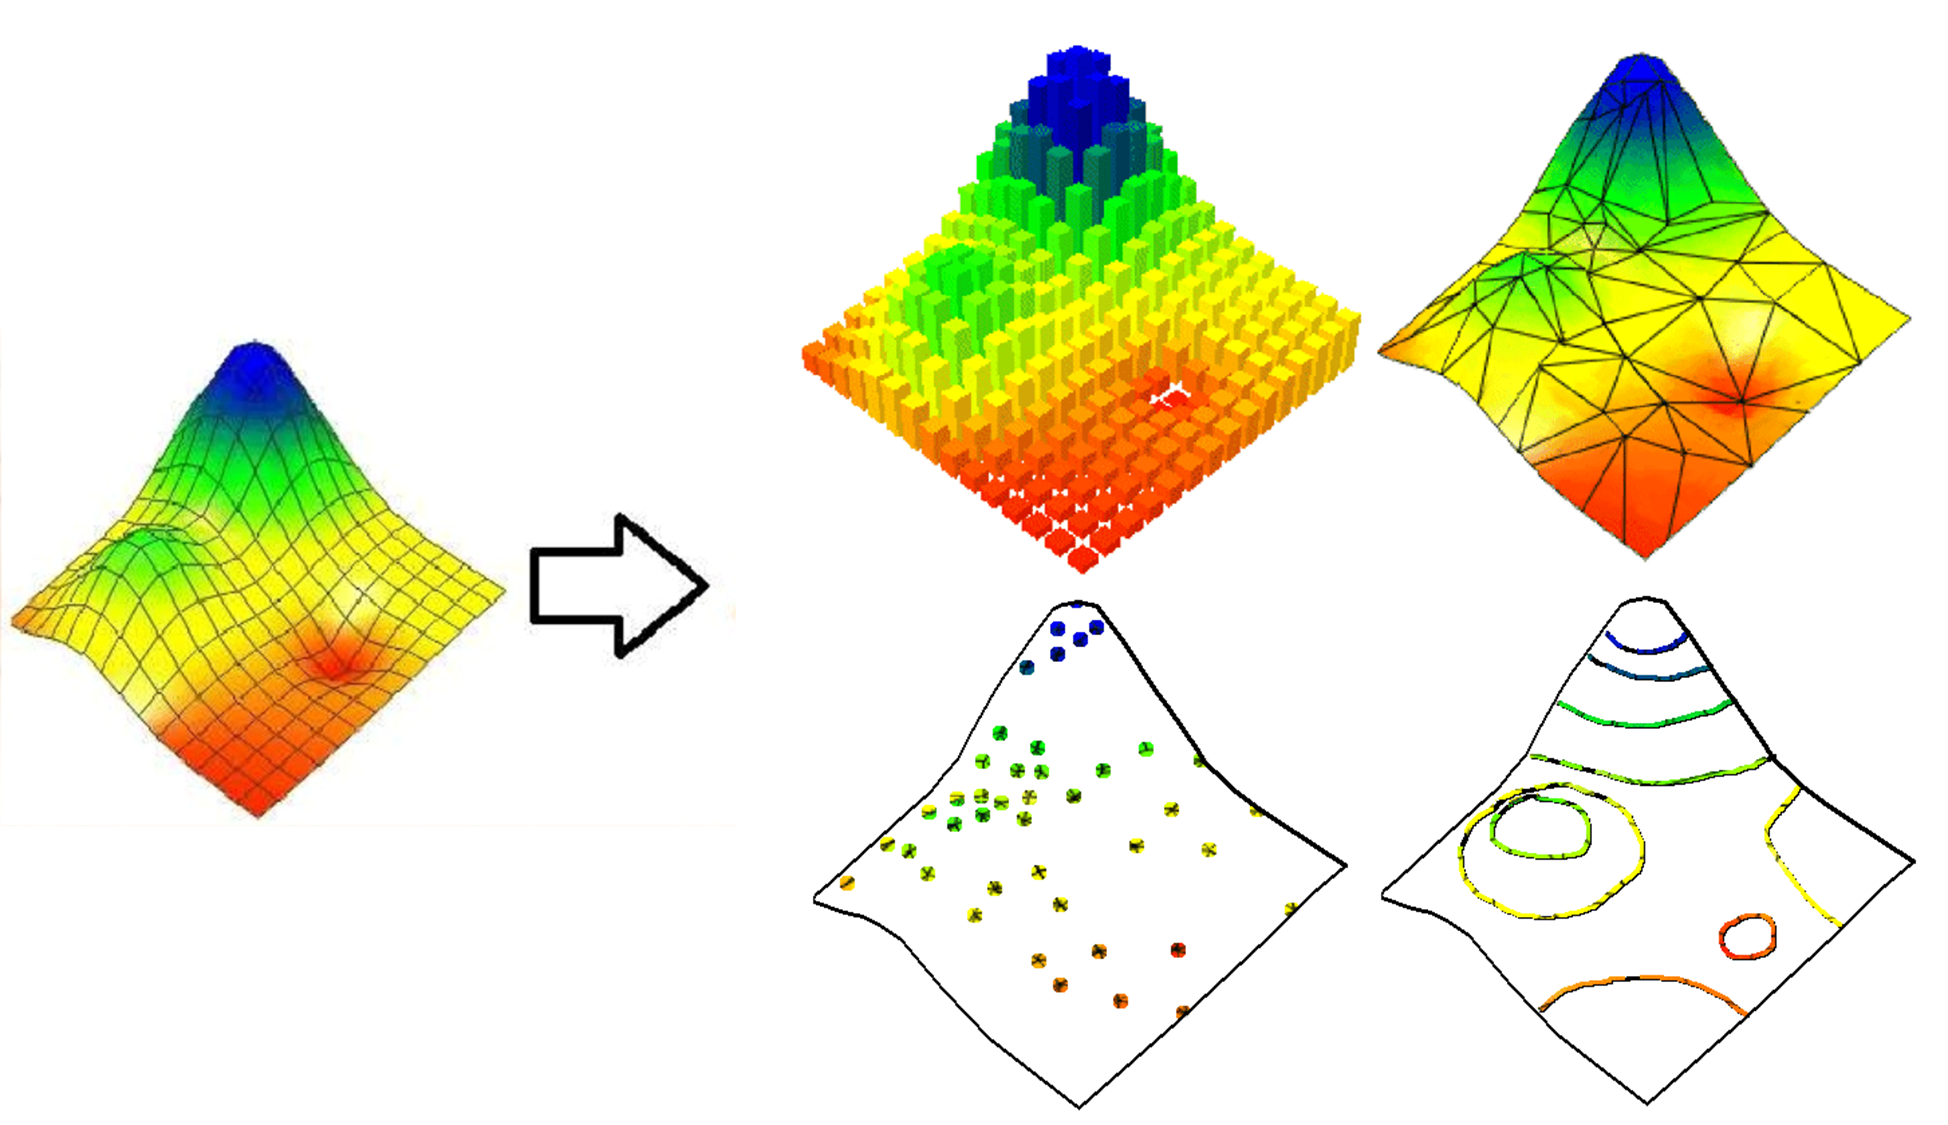
Part of data science is representing the real world with 1’s and 0’s. This is a challenging proposition as representing “reality” using two bits of information and then rendering that on what is typically a two-dimensional screen is a process fraught with theoretical simplifications, generalizations, and assumptions. While it might be common to reduce the types of data into two classes: vector and raster, I find it useful to pull vector apart a bit more. First and most tangibly, point clouds and points are distribution in different formats and represent different ends of the data size spectrum. While you might just have a handful of points represented in a csv, it is not uncommon to need to represent millions of points with an X,Y,Z, time, reflectance values, and a host of other metadata that are needed to efficiently interact with large scale measurements of the world realized as LIDAR. Meshes such as TIN’s area also a special case of vector data in that the connections of the different points are more easily represented in a TIN structure vs loose polygons, and the way in which software and the underlying mathematical models interact with the data make meshes a more appropriate form to convert the computational grid over their more generic vector alternatives. Therefore, when I talk about data types, I am typically referencing or conceptualizing the following forms. Don’t forget to check out FILE I/O if you are looking for tips on how to open and manipulate these.
- Point Clouds: How we measure much of the world.
- Meshes: How we (typically) model the world.
- Vectors: (small scale) points, lines, and polygons.
- Rasters: irregular and regularly gridded representations.