Junk Drawer
A place for me to dump some of my uncategorized work, links to great content creators, and other neat resources I’ve found along my way. Don’t forget to check out the resources listed at the top of my Atlas Page, or what I’m thinking about now.
Rapidfire links
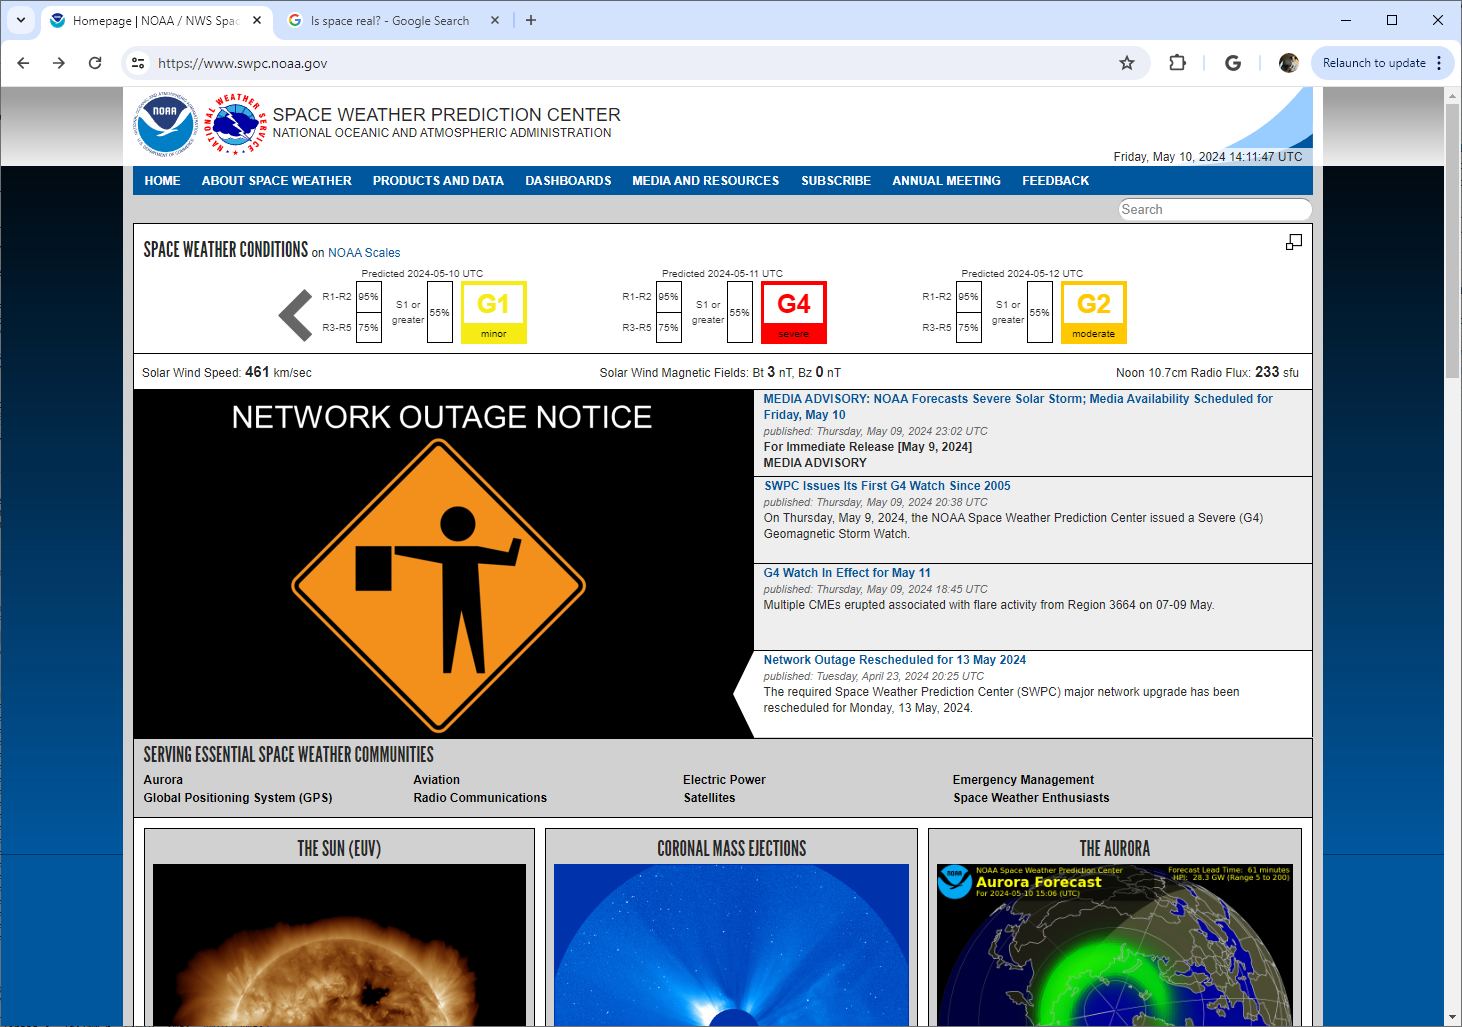
What’s going on?
National Weather Service landing page (pictured IMAGE LIVE UPDATES) | National Water prediction Service (NWPS) | NWS GIS Map1

Flood Hazard Outlook (pictured IMAGE LIVE UPDATES) | National Water Center Products | NWS GIS Map | National Water prediction Service (NWPS)

Water Dashboard (Modern NWIS) | NWIS (pictured IMAGE LIVE UPDATES) | StreamStats | EarthNow Live Landsat | Entwine | FIM | Earthquakes

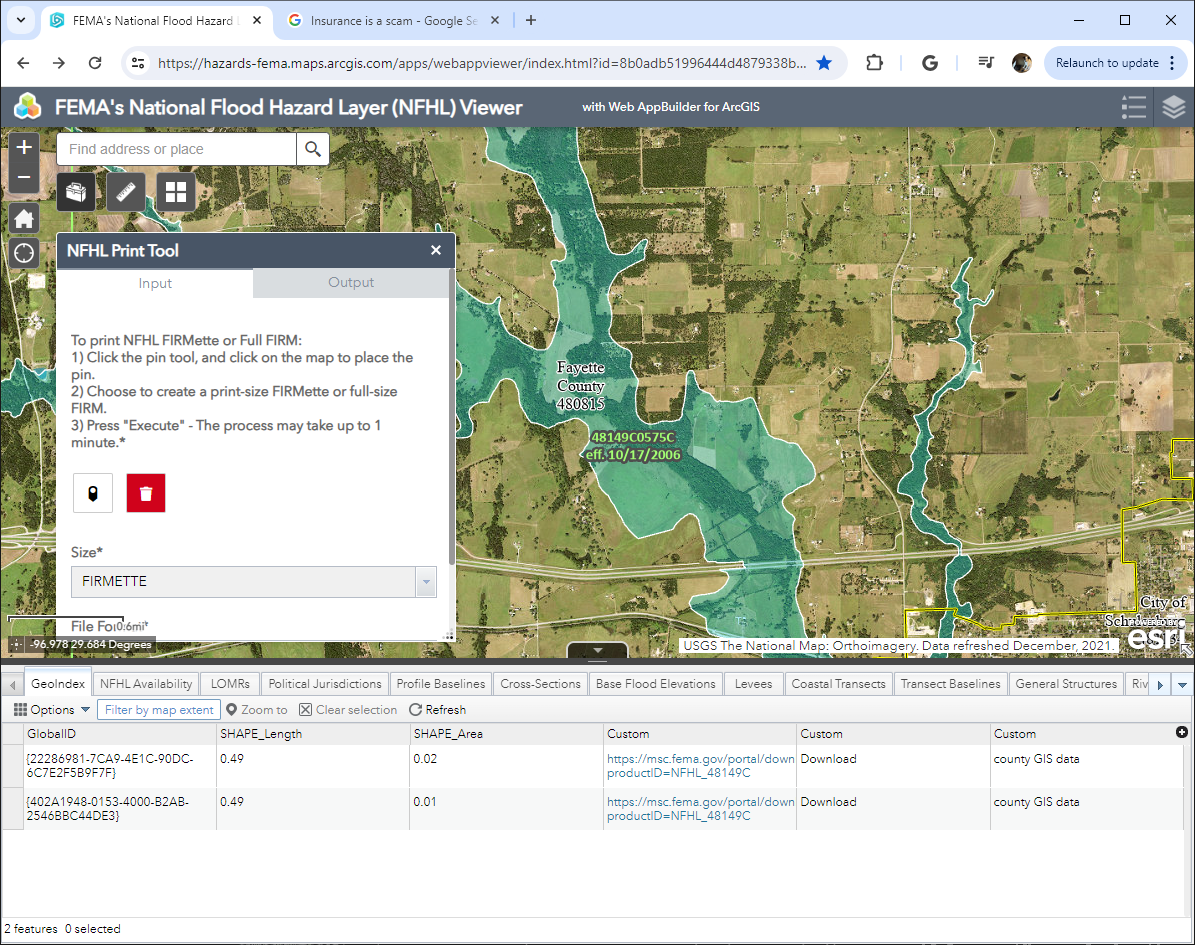
Flood Hazard and insurance rate maps

Worldviewr | EarthData (pictured) | Fire (Fire Information for Resource Management Systems - FIRMS)


College of DuPage:
SATRAD (pictured) | Obs | Models
Other:
ventusky | Windy | RealEarth | EUMETSAT | CW3E

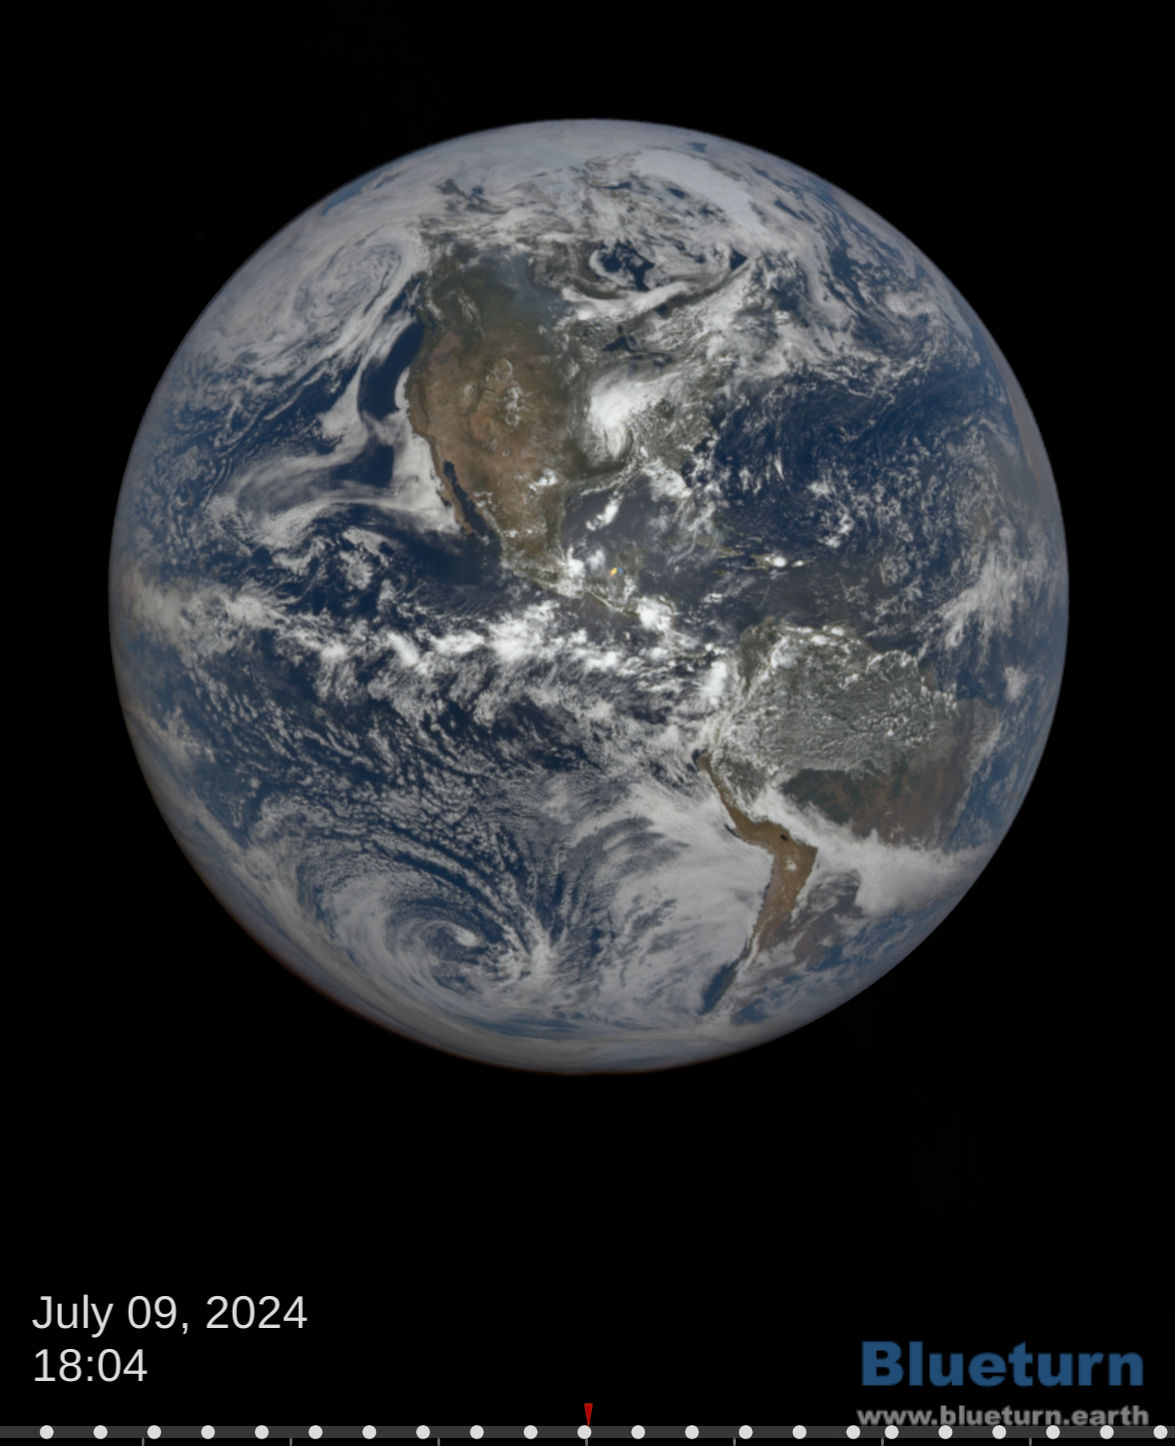
Climate and Norms | Geofolio | BlueTurn (it complains about security, it’s just unity)