# 1. Setup the data
dist_miles <- 4
dist_feet <- dist_miles * 5280
deviation_feet <- 0.1
df <- data.frame(
distance = c(0, dist_feet),
elevation = c(0, deviation_feet)
)
# 2. Create the plot
interp_deviation_plot <- ggplot2::ggplot(df, ggplot2::aes(x = distance, y = elevation)) +
ggplot2::geom_line(color = "#2c3e50", size = 1.2) +
ggplot2::geom_area(fill = "#3498db", alpha = 0.2) +
# Adding points to highlight the start and end
ggplot2::geom_point(color = "#e74c3c", size = 3) +
# Formatting labels
ggplot2::scale_x_continuous(
label = scales::label_number(suffix = " ft", big.mark = ","),
breaks = seq(0, dist_feet, length.out = 5)
) +
ggplot2::labs(
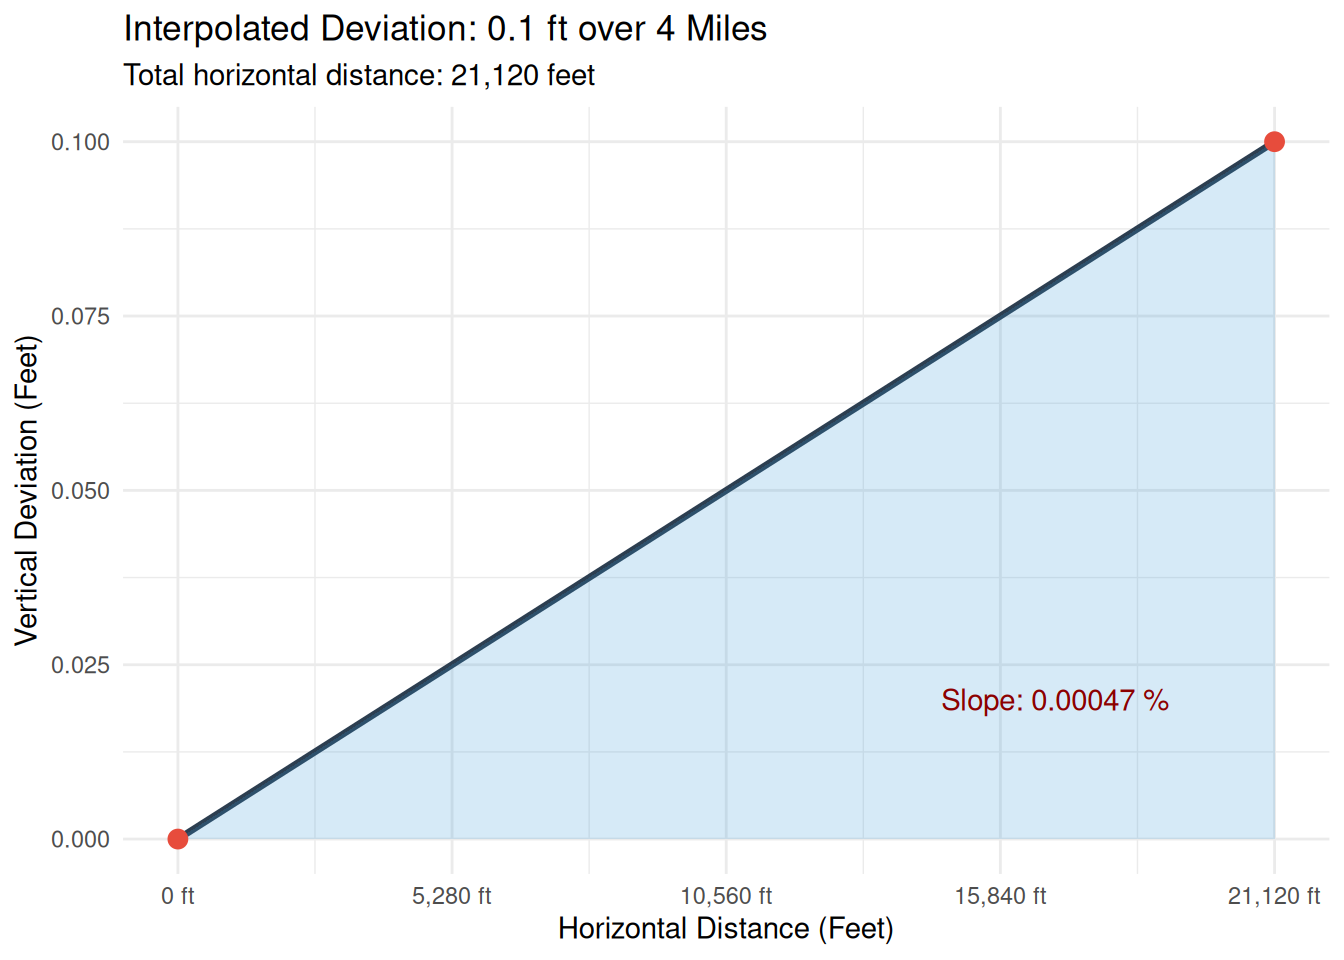
title = "Interpolated Deviation: 0.1 ft over 4 Miles",
subtitle = paste("Total horizontal distance:", scales::comma(dist_feet), "feet"),
x = "Horizontal Distance (Feet)",
y = "Vertical Deviation (Feet)"
) +
ggplot2::theme_minimal() +
# Note: In a true 1:1 scale, this line would look perfectly flat.
# We use a free scale here to make the deviation visible.
ggplot2::annotate("text", x = dist_feet * 0.8, y = 0.02,
label = paste("Slope:", round(deviation_feet/dist_feet * 100, 5), "%"),
color = "darkred")