Distribution

Example

How to

Hydrologic Distribution Fitting

The Purpose of Distribution Fitting

In hydrology, we rarely have enough historical data to directly calculate the probability of rare, extreme events like the “100-year flood” (an event with a 1% chance of occurring in any given year). Distribution fitting solves this by using the historical data we do have to anchor a theoretical mathematical curve. By calculating the statistical characteristics of our observed streamflow—such as the mean, variance, and skewness—we can select and scale a continuous probability distribution to match our historical record. Once fitted, this smooth curve allows us to extrapolate beyond our limited data and estimate the magnitude of extreme, unobserved events.

Why We Use L-Moments

Traditional statistical moments (standard deviation, traditional skewness) involve squaring or cubing the data, which gives massive, disproportionate weight to the largest outliers. In streamflow analysis, a single historic mega-flood can heavily skew traditional calculations and ruin the fit for the rest of the data. L-moments are calculated using linear combinations of the sorted data. This makes them far more robust against extreme outliers and generally provides a more reliable, stable fit for environmental data.

Common Extreme Value Distributions

Different distributions behave differently at the “tails” (the extreme upper ends of the curve). Choosing the right distribution dictates how conservatively or aggressively you are estimating the worst-case scenarios.

  • Generalized Extreme Value (GEV): A highly flexible, three-parameter distribution that acts as a parent family for extreme events. Its shape parameter allows it to adapt to data with varying tail behaviors, making it a globally popular choice for flood frequency analysis.
  • Gumbel (Extreme Value Type I): A simplified, two-parameter subset of the GEV family. Because it lacks a shape parameter, it assumes a constant skewness. It often has a “lighter tail,” meaning it can sometimes underestimate the magnitude of the most extreme, rare floods compared to other distributions.
  • Generalized Logistic (GLO): Another three-parameter distribution for extreme values, widely adopted as the standard for flood frequency analysis in the UK. Compared to the GEV, the GLO typically has a “heavier tail,” meaning it tends to predict larger magnitudes for the rarest events.
  • 3-Parameter Log-Normal (LN3): This assumes that the logarithm of the streamflow data follows a classic normal distribution (the bell curve), with a third parameter added to set a lower bound (since streamflow cannot be negative). It is highly versatile for positively skewed environmental data.
  • Pearson Type III (PE3) / Log-Pearson Type III: A highly adaptable three-parameter distribution that relies heavily on the data’s skewness to dictate its shape. When applied to the base-10 logarithm of the streamflow data (Log-Pearson Type III), it is the official standard for flood frequency analysis in the United States as defined by federal guidelines (England et al. (2019)).
Pulling data for USGS gauge: 01646500 
Warning in dataRetrieval::readNWISpeak(site_number): NWIS servers are slated
for decommission. Please begin to migrate to read_waterdata_peaks.
GET: https://nwis.waterdata.usgs.gov/usa/nwis/peak/?range_selection=date_range&format=rdb&site_no=01646500
GET: https://waterservices.usgs.gov/nwis/site/?siteOutput=Expanded&format=rdb&site=01646500
Successfully pulled 95 years of annual peak streamflow data.
[1] "Goodness of Fit (Ranked by Lowest RMSE):"
                     Distribution       RMSE
2      Generalized Logistic (GLO) 0.01827292
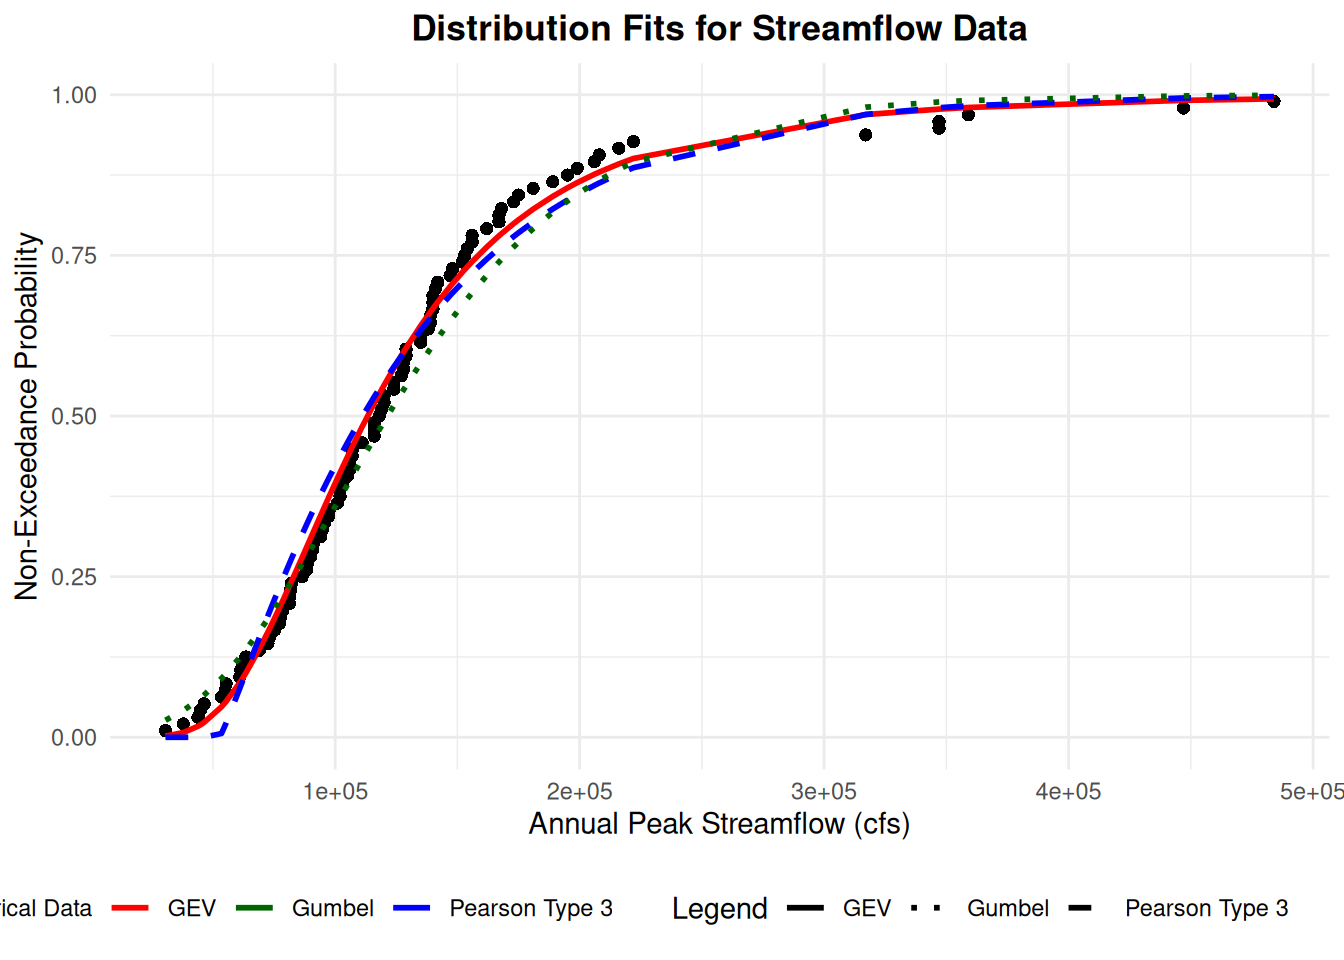
1 Generalized Extreme Value (GEV) 0.02470658
4          3-Parameter Log-Normal 0.03075569
3                          Gumbel 0.04149255
5                  Pearson Type 3 0.04286380

References

England, J. F., Jr., T. A. Cohn, B. A. Faber, et al. 2019. Guidelines for Determining Flood Flow Frequency—Bulletin 17C (Ver. 1.1, May 2019). Techniques and {{Methods}}. Techniques and Methods. U.S. Geological Survey Techniques and Methods.