path_to_data <- "~/data/raw"
target_depth_path <- file.path(path_to_data,"KDA_Kansas_raw_ras","LowerNeoshoWatershed_KS","Enhanced_Models","Neosho","LittleTurkeyCreekTrib1","HEC-RAS","500yr","WSE (Max).vrt",fsep = .Platform$file.sep)
model_surface_path <- file.path(path_to_data,"KDA_Kansas_raw_ras","LowerNeoshoWatershed_KS","Enhanced_Models","Neosho","LittleTurkeyCreekTrib1","HEC-RAS","Terrain","Terrain.hydroDEM.tif",fsep = .Platform$file.sep)
WSE <- terra::rast(target_depth_path)
surface <- terra::rast(model_surface_path)
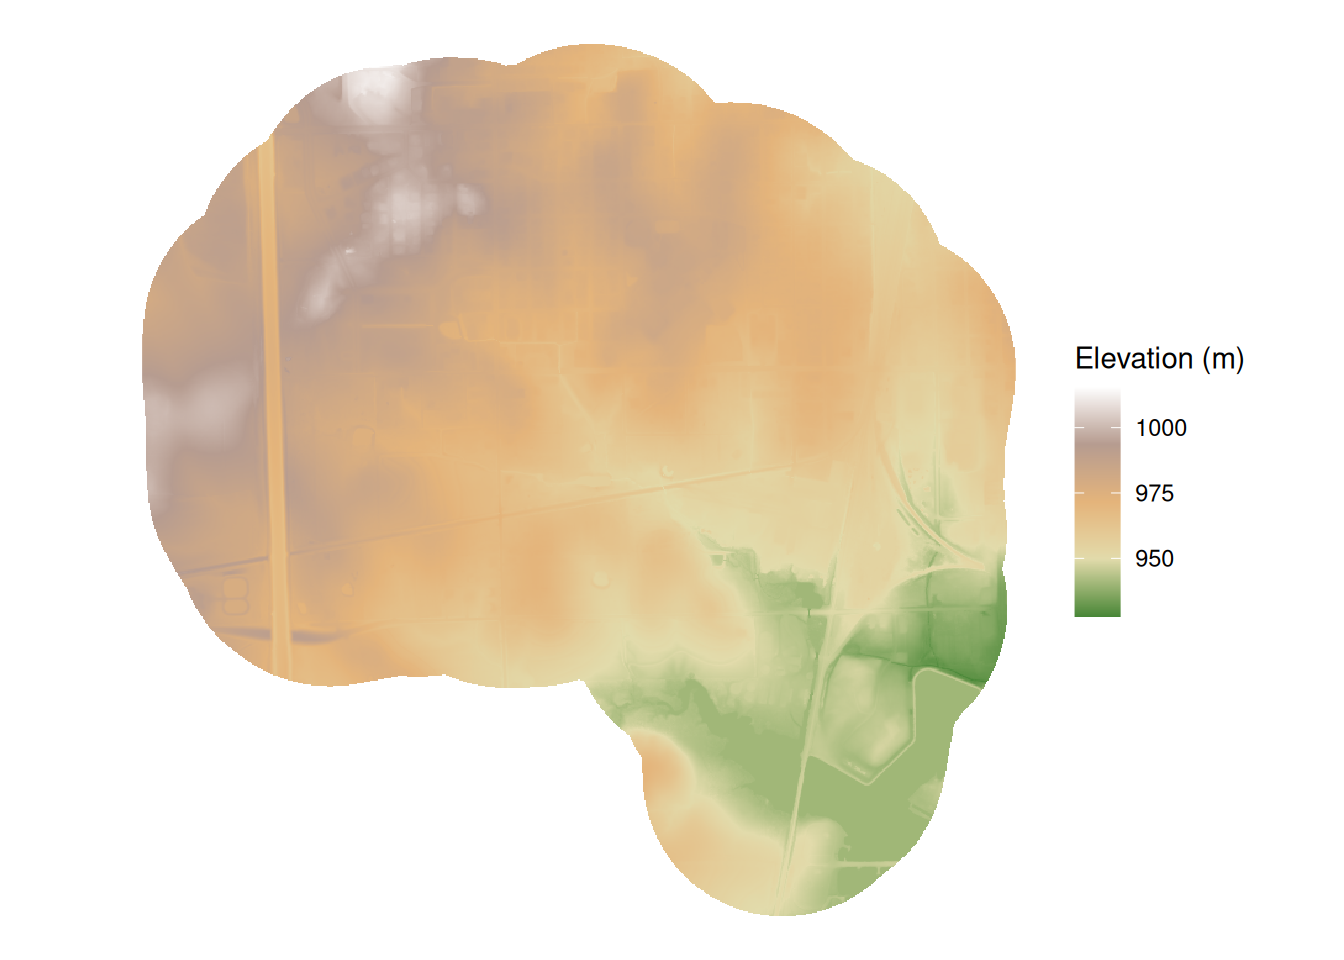
export_plot <- ggplot2::ggplot() +
tidyterra::geom_spatraster(data = surface) +
tidyterra::scale_fill_whitebox_c(name = "Elevation (m)") +
ggplot2::theme_void()Grid Index
Indexing views of space is a great way to functionalize navigation, communication, and the programmatic execution of a large scale image generation, mapbook, atlas (the QGIS term), or data driven page (ArcMap) equivalent. This was one of my favorite parts of GIS cartography and I don’t deploy it often enough. That changes now.
Reference
WarningSecret in the name of personal efficency
How sad is that…
Tesselation templates
Starting with a toy map we want to tessellate
Code
surface_index <- sf::st_make_grid(sf::st_bbox(surface) |> sf::st_as_sfc())

surface_index <- sf::st_as_sf(surface_index) |>
  dplyr::mutate(
    centroid = sf::st_centroid(sf::st_as_sf(surface_index)$x),
    index = 1:nrow(sf::st_as_sf(surface_index)),
    ) |>
  dplyr::mutate(
    label = index
  )

export_plot <- ggplot2::ggplot() +
  tidyterra::geom_spatraster(data = surface) +
  tidyterra::scale_fill_whitebox_c(name = "Surface Elevation (m)") +
  ggnewscale::new_scale_fill() +
  tidyterra::geom_spatraster(data = WSE, mapping = ggplot2::aes(fill = ggplot2::after_stat(value)), alpha = 0.7) +
  ggplot2::scale_fill_viridis_c(name = "WSE (m)", option = "B",na.value = NA) +
  ggplot2::geom_sf(data = surface_index, color = "black",fill="transparent") +
  ggplot2::geom_sf_text(
    data = surface_index,
    mapping = ggplot2::aes(label = label, geometry = centroid),
    size = 2.5, # Adjust size as needed
    color = "black"
  ) +
  ggplot2::theme_void()
export_plot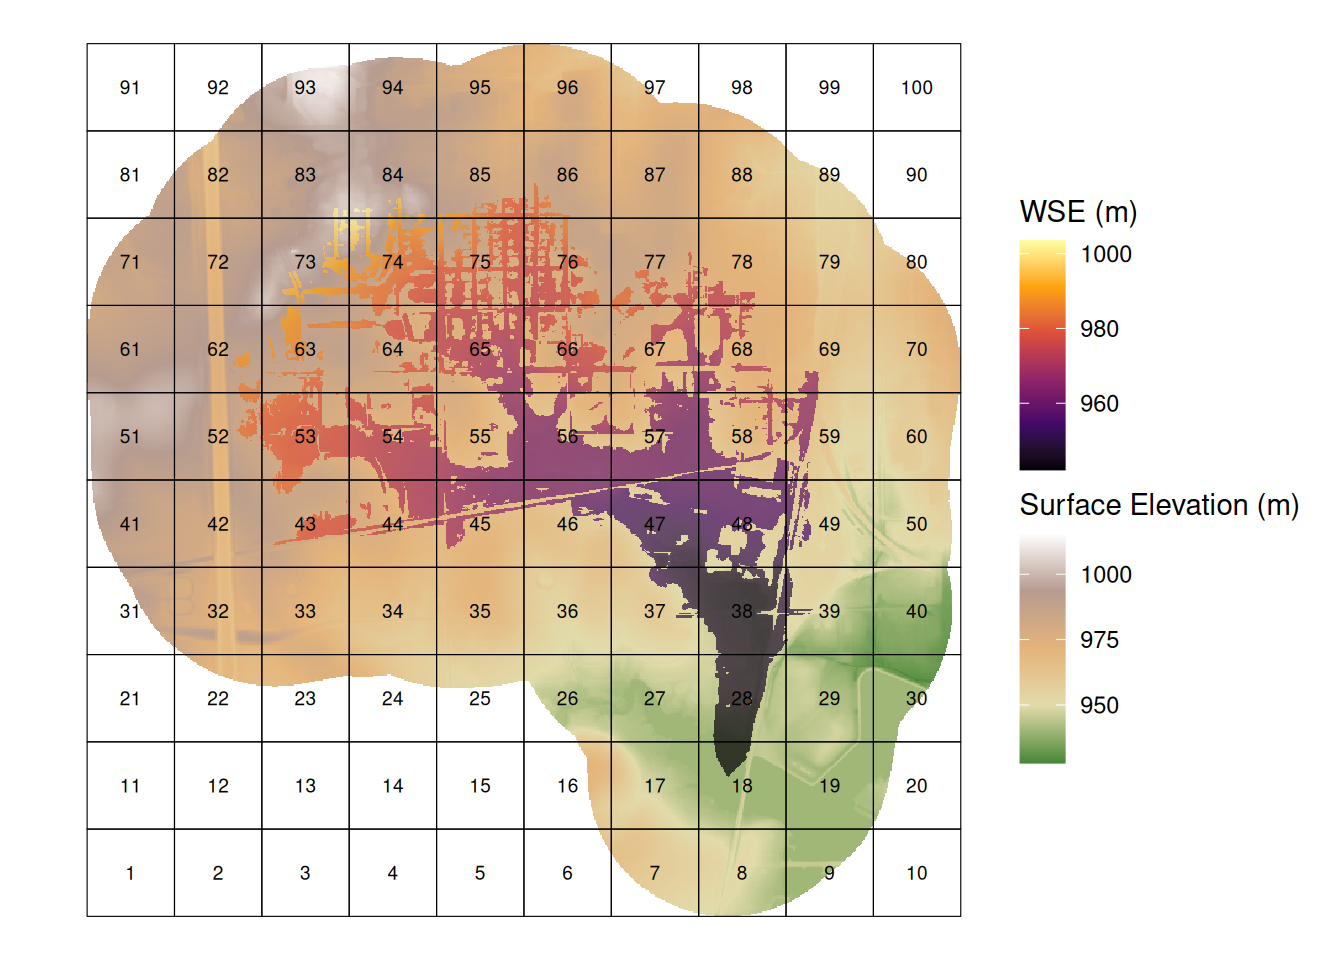
Code
# surface_index <- sf::st_make_grid(sf::st_buffer(sf::st_bbox(surface) |> sf::st_as_sfc(),units::as_units(50,'m')))
surface_index <- sf::st_make_grid(sf::st_bbox(surface) |> sf::st_as_sfc())

n_cols <- length(unique(sf::st_coordinates(surface_index)[, 1]))-1
n_rows <- length(unique(sf::st_coordinates(surface_index)[, 2]))-1
extend <- function(alphabet) function(i) {
  base10toA <- function(n, A) {
    stopifnot(n >= 0L)
    N <- length(A)
    j <- n %/% N
    if (j == 0L) A[n + 1L] else paste0(Recall(j - 1L, A), A[n %% N + 1L])
  }
  vapply(i-1L, base10toA, character(1L), alphabet)
}
MORELETTERS <- extend(LETTERS)
surface_index <- sf::st_as_sf(surface_index) |>
  dplyr::mutate(
    centroid = sf::st_centroid(sf::st_as_sf(surface_index)$x),
    index = 1:nrow(sf::st_as_sf(surface_index)),
    col_index = rep(1:n_cols, times = n_rows),
    row_index = rep(rev(MORELETTERS(c(1:n_rows))), each = n_cols) # rev to flip
    ) |>
  # Combine row and column indices to create the "battleship" label (e.g., A1, B2)
  dplyr::mutate(
    label = paste0(row_index, col_index)
  )

export_plot <- ggplot2::ggplot() +
  tidyterra::geom_spatraster(data = surface) +
  tidyterra::scale_fill_whitebox_c(name = "Surface Elevation (m)") +
  ggplot2::geom_sf(data = surface_index, color = "black",fill="transparent") +
  ggplot2::geom_sf_text(
    data = surface_index,
    mapping = ggplot2::aes(label = label, geometry = centroid),
    size = 2.5, # Adjust size as needed
    color = "black"
  ) +
  ggplot2::theme_void()
export_plot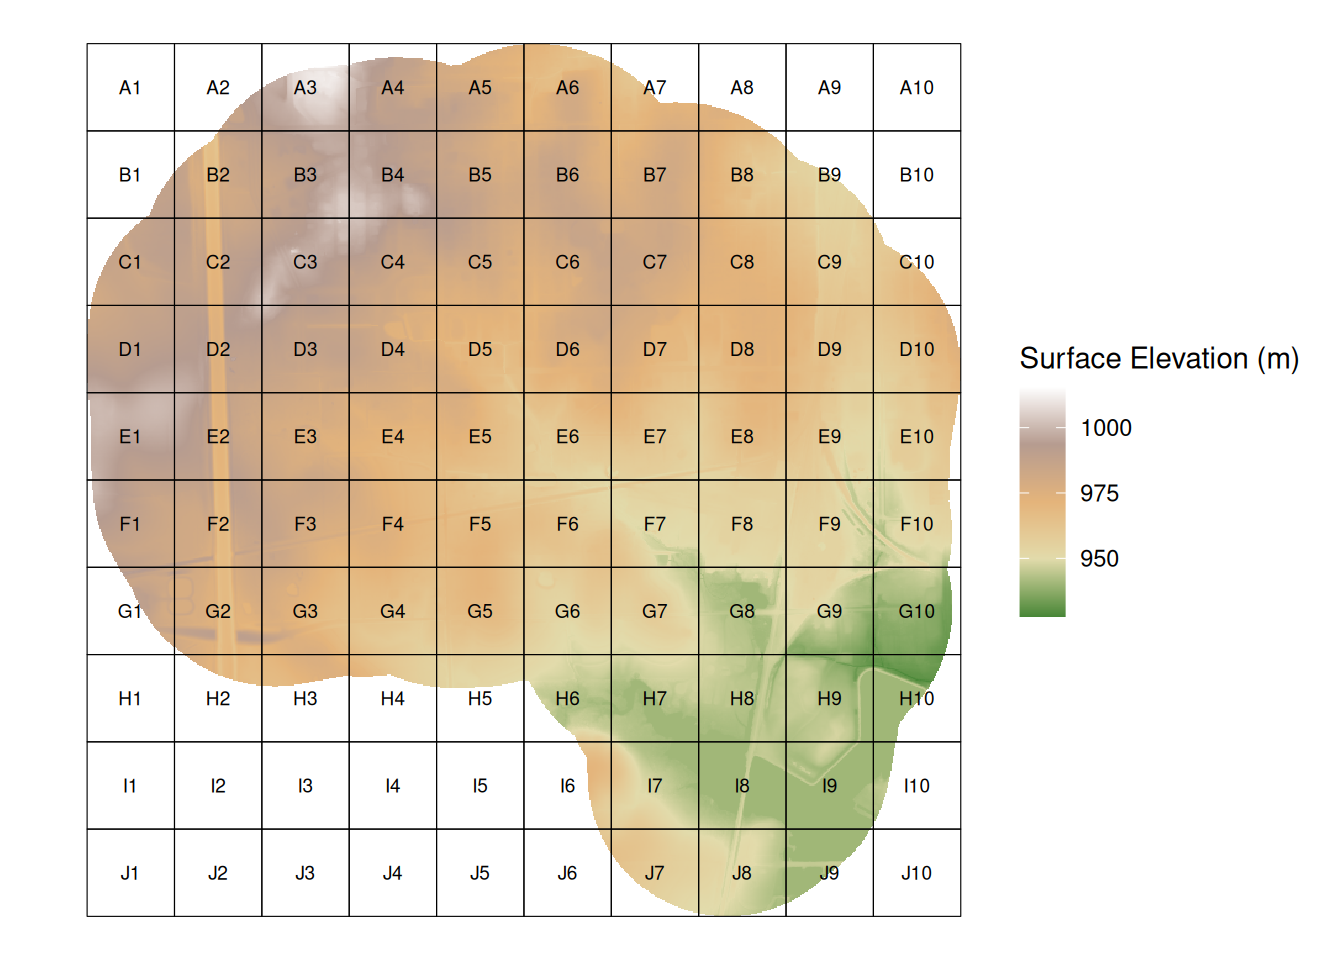
Code
WSE <- terra::rast(target_depth_path)
surface <- terra::rast(model_surface_path)
surface_index <- sf::st_make_grid(sf::st_bbox(surface) |> sf::st_as_sfc())
bbox <- sf::st_bbox(surface_index)
x_cell_size <- (bbox[["xmax"]] - bbox[["xmin"]]) / n_cols
y_cell_size <- (bbox[["ymax"]] - bbox[["ymin"]]) / n_cols
x_offset <- -x_cell_size
y_offset <- y_cell_size

n_cols <- length(unique(sf::st_coordinates(surface_index)[, 1]))-1
n_rows <- length(unique(sf::st_coordinates(surface_index)[, 2]))-1
extend <- function(alphabet) function(i) {
  base10toA <- function(n, A) {
    stopifnot(n >= 0L)
    N <- length(A)
    j <- n %/% N
    if (j == 0L) A[n + 1L] else paste0(Recall(j - 1L, A), A[n %% N + 1L])
  }
  vapply(i-1L, base10toA, character(1L), alphabet)
}
MORELETTERS <- extend(LETTERS)

surface_index <- sf::st_as_sf(surface_index) |>
  dplyr::mutate(
    centroid = sf::st_centroid(sf::st_as_sf(surface_index)$x),
    col_index = rep(1:n_cols, times = n_rows),
    row_index = rep(rev(MORELETTERS(c(1:n_rows))), each = n_cols)
  ) |>
  dplyr::mutate(
    label = paste0(row_index, col_index)
  )

surface_index$shift_x <- surface_index$x + c(x_offset, 0)
sf::st_crs(surface_index$shift_x) <- sf::st_crs(surface_index$x)
surface_index$shift_y <- surface_index$x + c(0, y_offset)
sf::st_crs(surface_index$shift_y) <- sf::st_crs(surface_index$x)

export_plot <- ggplot2::ggplot() +
  tidyterra::geom_spatraster(data = surface) +
  tidyterra::scale_fill_whitebox_c(name = "Surface Elevation (m)") +
  ggnewscale::new_scale_fill() +
  tidyterra::geom_spatraster(data = WSE, mapping = ggplot2::aes(fill = ggplot2::after_stat(value)), alpha = 0.7) +
  ggplot2::scale_fill_viridis_c(name = "WSE (m)", option = "B",na.value = NA) +
  ggplot2::geom_sf(data = surface_index, mapping = ggplot2::aes(geometry = x),color = "black",fill="transparent") +
  ggplot2::geom_sf_text(data = surface_index,mapping = ggplot2::aes(label = label, geometry = x),size = 2.5,color = "black") +

  ggplot2::geom_sf(data = surface_index[surface_index$col_index==1,], mapping = ggplot2::aes(geometry = shift_x),color = "black",fill="white") +
  ggplot2::geom_sf_text(data = surface_index[surface_index$col_index==1,],mapping = ggplot2::aes(label = row_index, geometry = shift_x),size = 2.5,color = "black") +
  ggplot2::geom_sf(data = surface_index[surface_index$row_index=='A',], mapping = ggplot2::aes(geometry = shift_y),color = "black",fill="white") +
  ggplot2::geom_sf_text(data = surface_index[surface_index$row_index=='A',],mapping = ggplot2::aes(label = col_index, geometry = shift_y),size = 2.5,color = "black") +
  ggplot2::theme_void()
export_plot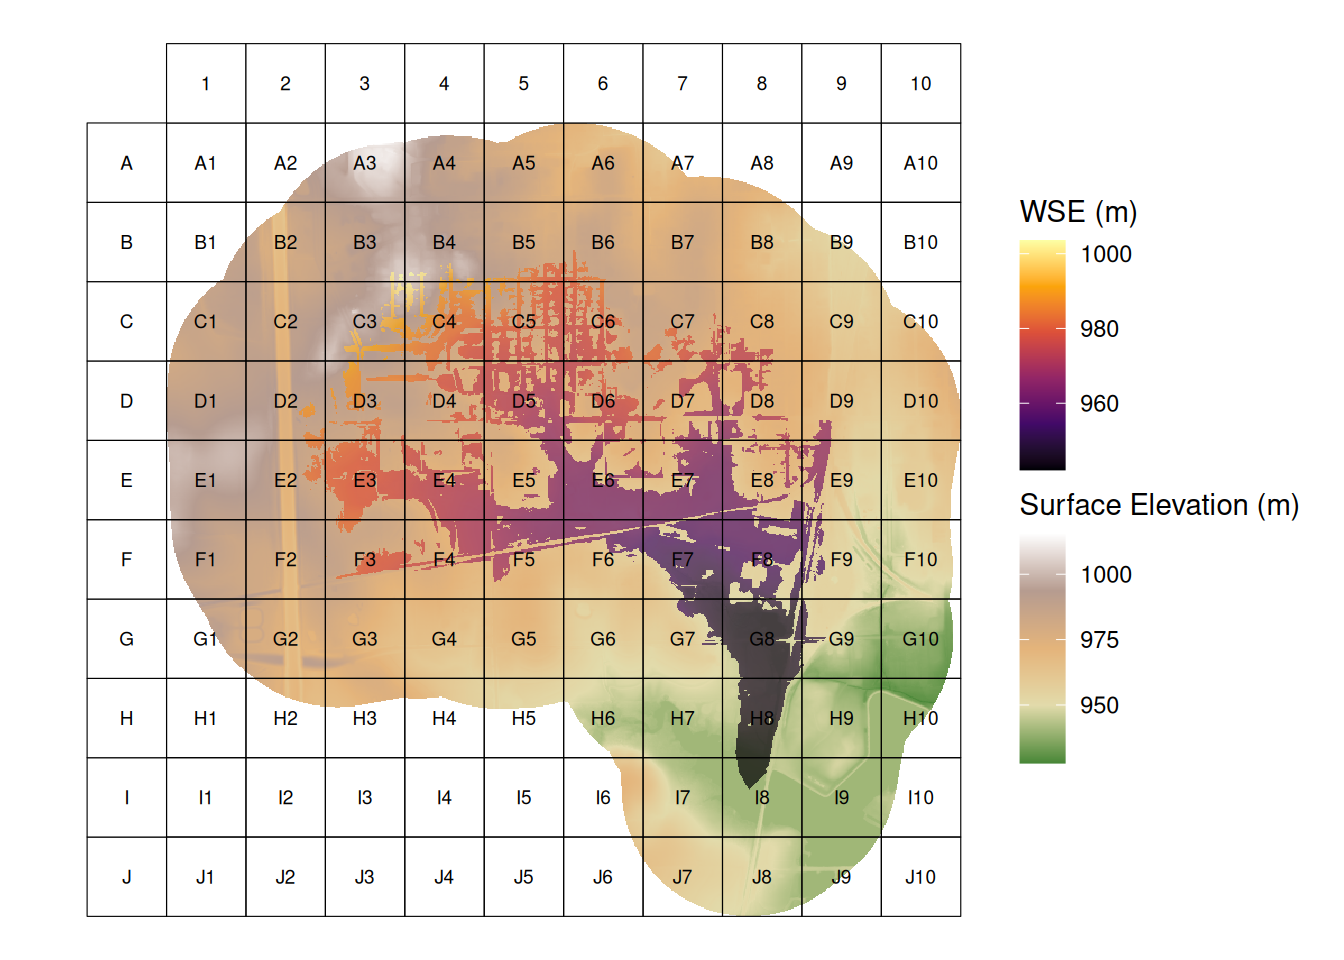
Code
WSE <- terra::rast(target_depth_path)
surface <- terra::rast(model_surface_path)

bbox <- sf::st_bbox(surface_index)
surface_index <- sf::st_make_grid(bbox |> sf::st_as_sfc())
n_cols <- length(unique(sf::st_coordinates(surface_index)[, 1]))-1
n_rows <- length(unique(sf::st_coordinates(surface_index)[, 2]))-1

x_cell_size <- (bbox[["xmax"]] - bbox[["xmin"]]) / n_cols
y_cell_size <- (bbox[["ymax"]] - bbox[["ymin"]]) / n_cols
x_offset <- -x_cell_size
y_offset <- y_cell_size

extend <- function(alphabet) function(i) {
  base10toA <- function(n, A) {
    stopifnot(n >= 0L)
    N <- length(A)
    j <- n %/% N
    if (j == 0L) A[n + 1L] else paste0(Recall(j - 1L, A), A[n %% N + 1L])
  }
  vapply(i-1L, base10toA, character(1L), alphabet)
}
MORELETTERS <- extend(LETTERS)

surface_index <- sf::st_as_sf(surface_index) |>
  dplyr::mutate(
    centroid = sf::st_centroid(sf::st_as_sf(surface_index)$x),
    col_index = rep(1:n_cols, times = n_rows),
    row_index = rep(rev(MORELETTERS(c(1:n_rows))), each = n_cols)
  ) |>
  dplyr::mutate(
    label = paste0(row_index, col_index)
  )

# surface_index
surface_index$shift_x_p <- surface_index$x + c(x_offset, 0)
surface_index$shift_x_n <- surface_index$x - c(x_offset, 0)
sf::st_crs(surface_index$shift_x_p) <- sf::st_crs(surface_index$x)
sf::st_crs(surface_index$shift_x_n) <- sf::st_crs(surface_index$x)
surface_index$shift_y_p <- surface_index$x + c(0, y_offset)
surface_index$shift_y_n <- surface_index$x - c(0, y_offset)
sf::st_crs(surface_index$shift_y_p) <- sf::st_crs(surface_index$x)
sf::st_crs(surface_index$shift_y_n) <- sf::st_crs(surface_index$x)

export_plot <- ggplot2::ggplot() +
  tidyterra::geom_spatraster(data = surface) +
  tidyterra::scale_fill_whitebox_c(name = "Surface Elevation (m)") +
  ggnewscale::new_scale_fill() +
  tidyterra::geom_spatraster(data = WSE, mapping = ggplot2::aes(fill = ggplot2::after_stat(value)), alpha = 0.7) +
  ggplot2::scale_fill_viridis_c(name = "WSE (m)", option = "B",na.value = NA) +
  ggplot2::geom_sf(data = surface_index, mapping = ggplot2::aes(geometry = x),color = "black",fill="transparent") +
  ggplot2::geom_sf_text(data = surface_index,mapping = ggplot2::aes(label = label, geometry = x),size = 2.5,color = "black") +

  ggplot2::geom_sf(data = surface_index[surface_index$col_index==1,], mapping = ggplot2::aes(geometry = shift_x_p),color = "black",fill="white") +
  ggplot2::geom_sf_text(data = surface_index[surface_index$col_index==1,],mapping = ggplot2::aes(label = row_index, geometry = shift_x_p),size = 2.5,color = "black") +
  ggplot2::geom_sf(data = surface_index[surface_index$row_index=='A',], mapping = ggplot2::aes(geometry = shift_y_p),color = "black",fill="white") +
  ggplot2::geom_sf_text(data = surface_index[surface_index$row_index=='A',],mapping = ggplot2::aes(label = col_index, geometry = shift_y_p),size = 2.5,color = "black") +

    ggplot2::geom_sf(data = surface_index[surface_index$col_index==max(surface_index$col_index),], mapping = ggplot2::aes(geometry = shift_x_n),color = "black",fill="white") +
  ggplot2::geom_sf_text(data = surface_index[surface_index$col_index==max(surface_index$col_index),],mapping = ggplot2::aes(label = row_index, geometry = shift_x_n),size = 2.5,color = "black") +
  ggplot2::geom_sf(data = surface_index[surface_index$row_index==max(surface_index$row_index),], mapping = ggplot2::aes(geometry = shift_y_n),color = "black",fill="white") +
  ggplot2::geom_sf_text(data = surface_index[surface_index$row_index==max(surface_index$row_index),],mapping = ggplot2::aes(label = col_index, geometry = shift_y_n),size = 2.5,color = "black") +
  ggplot2::theme_void()
export_plot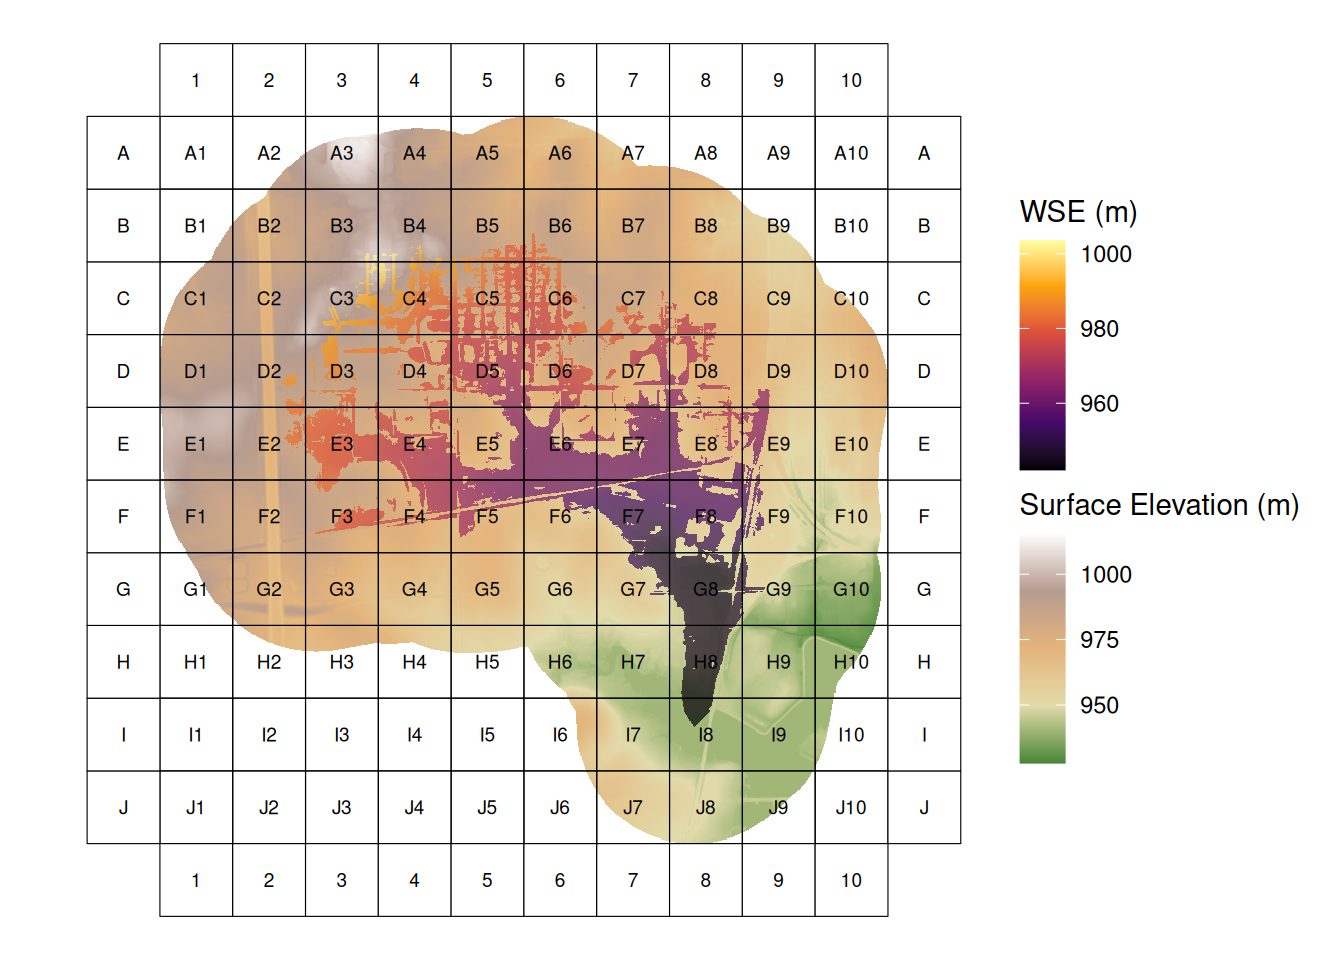
Code
# surface_index <- sf::st_make_grid(sf::st_buffer(sf::st_bbox(surface) |> sf::st_as_sfc(),units::as_units(50,'m')))
surface_index <- sf::st_make_grid(sf::st_bbox(surface) |> sf::st_as_sfc(),square = FALSE)

surface_index <- sf::st_as_sf(surface_index) |>
  dplyr::mutate(
    centroid = sf::st_centroid(sf::st_as_sf(surface_index)$x),
    index = 1:nrow(sf::st_as_sf(surface_index)),
    ) |>
  dplyr::mutate(
    label = index
  )

export_plot <- ggplot2::ggplot() +
  tidyterra::geom_spatraster(data = surface) +
  tidyterra::scale_fill_whitebox_c(name = "Surface Elevation (m)") +
  ggnewscale::new_scale_fill() +
  tidyterra::geom_spatraster(data = WSE, mapping = ggplot2::aes(fill = ggplot2::after_stat(value)), alpha = 0.7) +
  ggplot2::scale_fill_viridis_c(name = "WSE (m)", option = "B",na.value = NA) +
  ggplot2::geom_sf(data = surface_index, color = "black",fill="transparent") +
  ggplot2::geom_sf_text(
    data = surface_index,
    mapping = ggplot2::aes(label = label, geometry = centroid),
    size = 2.5, # Adjust size as needed
    color = "black"
  ) +
  ggplot2::theme_void()
export_plot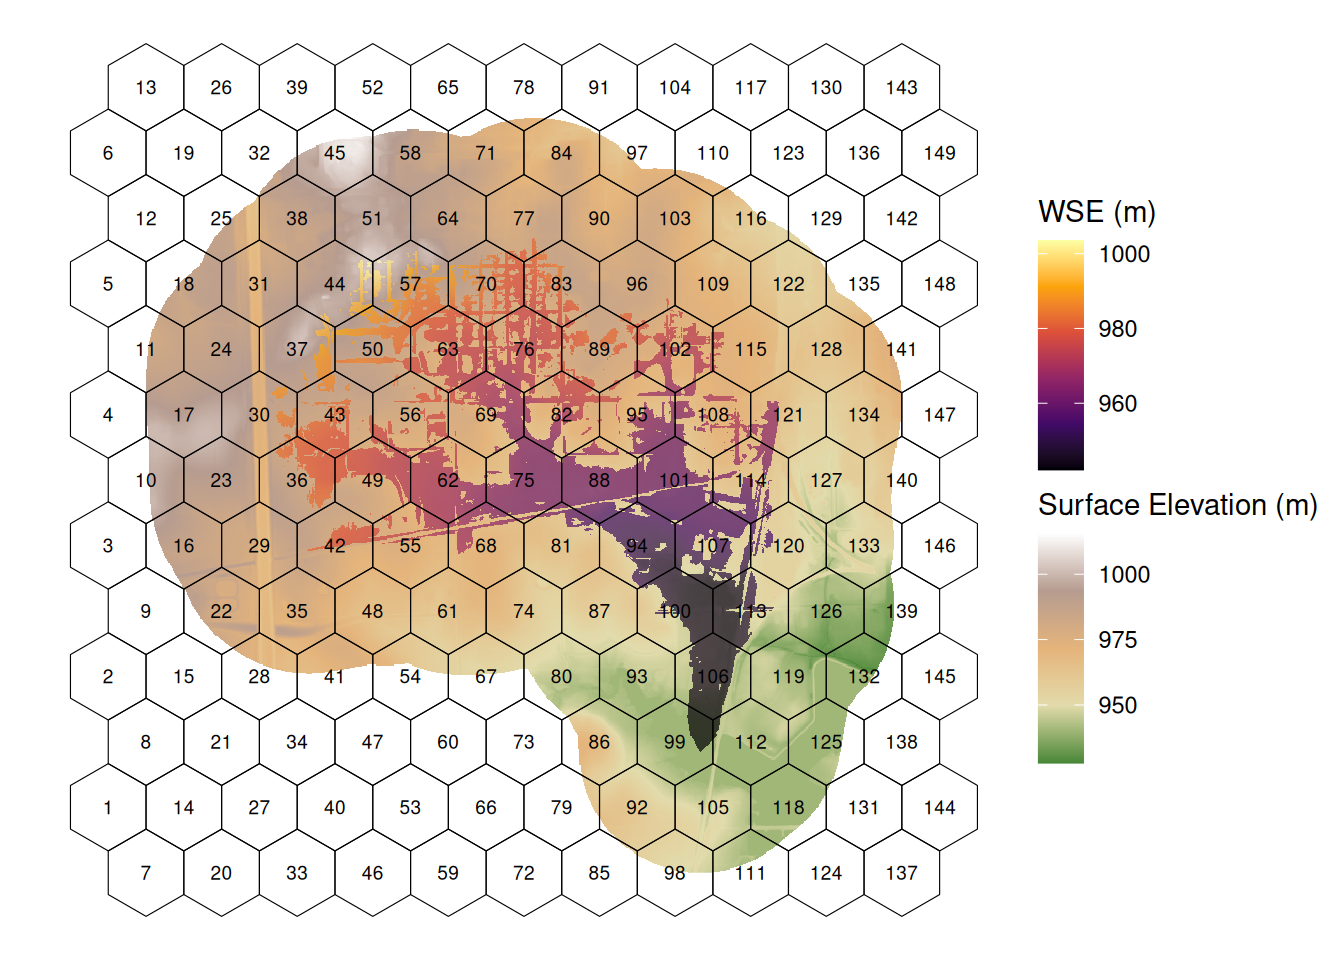
Code
# surface_index <- sf::st_make_grid(sf::st_buffer(sf::st_bbox(surface) |> sf::st_as_sfc(),units::as_units(50,'m')))
surface_index <- sf::st_make_grid(sf::st_bbox(surface) |> sf::st_as_sfc(),square = FALSE,flat_topped = TRUE)

surface_index <- sf::st_as_sf(surface_index) |>
  dplyr::mutate(
    centroid = sf::st_centroid(sf::st_as_sf(surface_index)$x),
    index = 1:nrow(sf::st_as_sf(surface_index)),
    ) |>
  dplyr::mutate(
    label = index
  )

export_plot <- ggplot2::ggplot() +
  tidyterra::geom_spatraster(data = surface) +
  tidyterra::scale_fill_whitebox_c(name = "Surface Elevation (m)") +
  ggnewscale::new_scale_fill() +
  tidyterra::geom_spatraster(data = WSE, mapping = ggplot2::aes(fill = ggplot2::after_stat(value)), alpha = 0.7) +
  ggplot2::scale_fill_viridis_c(name = "WSE (m)", option = "B",na.value = NA) +
  ggplot2::geom_sf(data = surface_index, color = "black",fill="transparent") +
  ggplot2::geom_sf_text(
    data = surface_index,
    mapping = ggplot2::aes(label = label, geometry = centroid),
    size = 2.5, # Adjust size as needed
    color = "black"
  ) +
  ggplot2::theme_void()
export_plot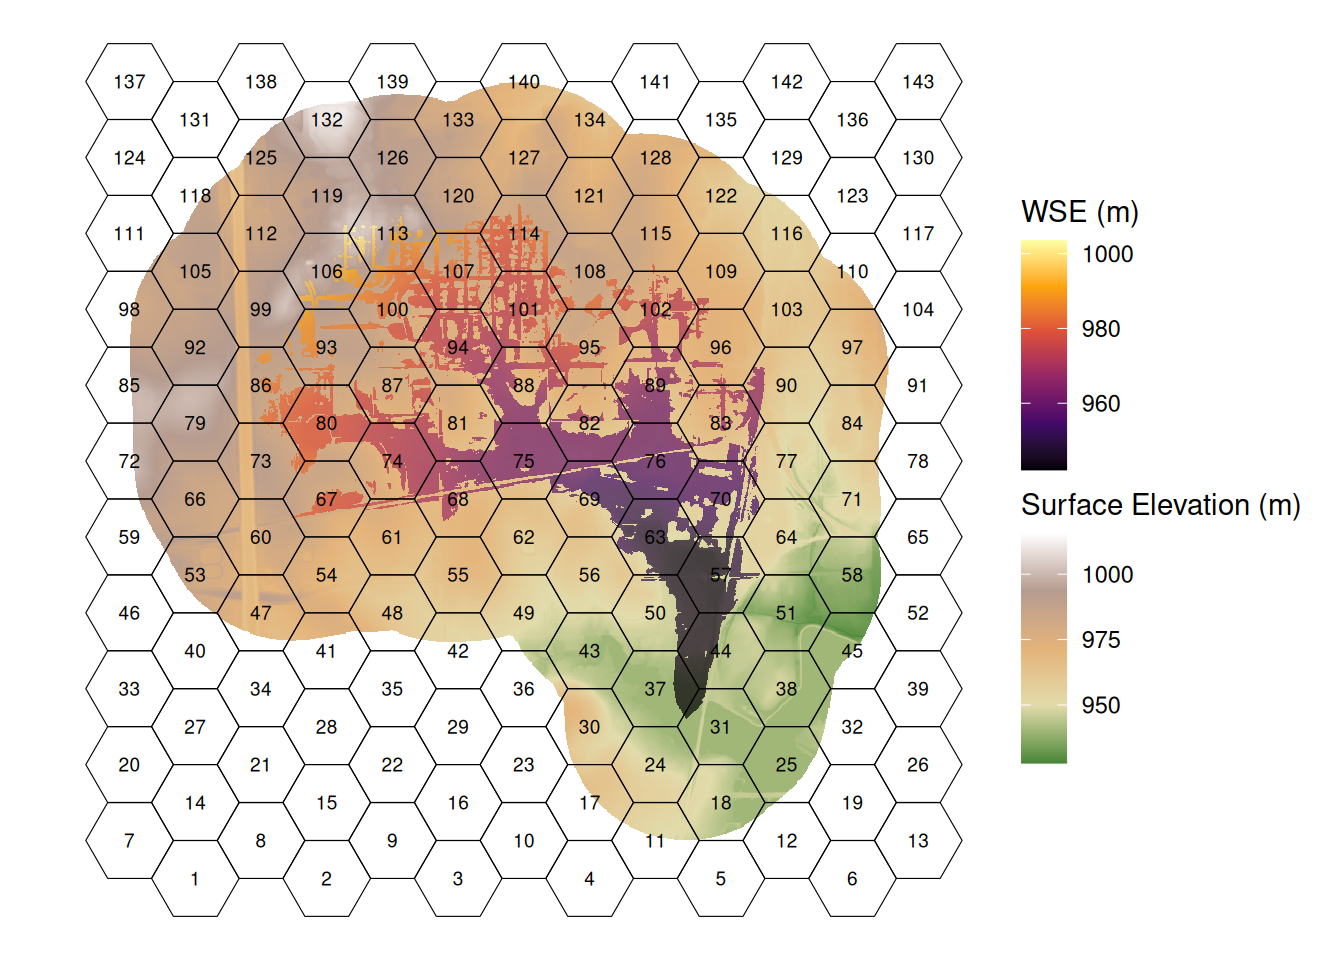
Code
# surface_index <- sf::st_make_grid(sf::st_buffer(sf::st_bbox(surface) |> sf::st_as_sfc(),units::as_units(50,'m')))
surface_index <- sf::st_make_grid(sf::st_bbox(surface) |> sf::st_as_sfc(),square = FALSE)

surface_index <- sf::st_as_sf(surface_index) |>
  dplyr::mutate(
    centroid = sf::st_centroid(sf::st_as_sf(surface_index)$x),
    index = 1:nrow(sf::st_as_sf(surface_index)),
    ) |>
  dplyr::mutate(
    label = index
  )

surface_index <- surface_index[terra::as.polygons(WSE, dissolve = T) |> sf::st_as_sf(), ]

export_plot <- ggplot2::ggplot() +
  tidyterra::geom_spatraster(data = surface) +
  tidyterra::scale_fill_whitebox_c(name = "Surface Elevation (m)") +
  ggnewscale::new_scale_fill() +
  tidyterra::geom_spatraster(data = WSE, mapping = ggplot2::aes(fill = ggplot2::after_stat(value)), alpha = 0.7) +
  ggplot2::scale_fill_viridis_c(name = "WSE (m)", option = "B",na.value = NA) +
  ggplot2::geom_sf(data = surface_index, color = "black",fill="transparent") +
  ggplot2::geom_sf_text(
    data = surface_index,
    mapping = ggplot2::aes(label = label, geometry = centroid),
    size = 2.5, # Adjust size as needed
    color = "black"
  ) +
  ggplot2::theme_void()
export_plot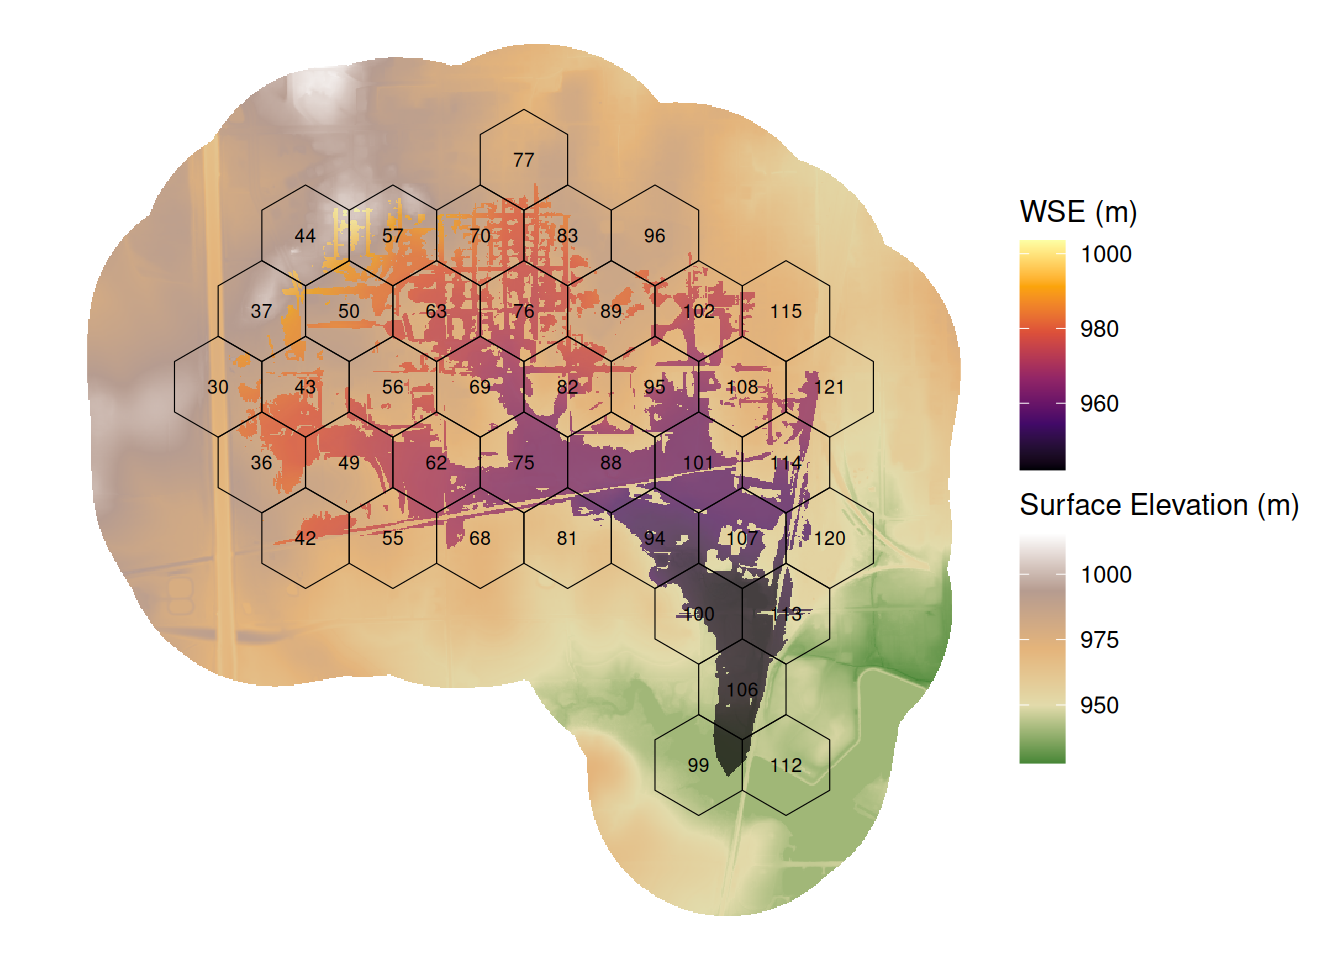
Todo