Lab 07 - Digital Terrain Analysis
This lab is a gratefully modified version of lab 13 from Bradley A. Shellito’s Introduction to Geospatial Technologies 934
This chapter’s lab introduces some of the basics of digital terrain modeling: working with DTMs, slope, viewsheds, and imagery draped over the terrain model. You’ll be using the free Google Earth Pro for this lab. The goals for you to take away from this lab:
- Examine pseudo-3D terrain and navigate across it in Google Earth Pro
- Examine the effects of different levels of vertical exaggeration on the terrain
- Create a viewshed and analyze the result
- Create an animation that simulates flight over 3D terrain in Google Earth Pro
- Create an elevation profile for use in examining a DTM and slope information
Outline:
| Data Name | Description |
|---|---|
| GEOG111_Lab08Questions.docx | Handout to turn in |
- Start Google Earth Pro (GEP). By default, GEP’s Terrain option is turned on for you. Look in the Layers box to ensure that there is a checkmark next to Terrain. This option drapes the imagery over a DTM (Digital Terrain Model).
- There are several sources for this terrain, so let’s make sure we are using the highest quality one. Because this lab is focused on digital terrain modeling, you should use the most detailed DTM possible, so from the Tools pull-down menu, select Options. In the Google Earth Options dialog box that appears, make sure the checkmark Use high quality terrain (disable for quicker resolution and faster rendering) is on. While in the options, click on the Navigation tab and set the Automatically tilt when zooming radio button. Click Apply and then OK.
- In the Search box, type “Zion National Park, UT” and GEP zooms down to the area of Zion National Park. In the Layers box, expand the More option and place a checkmark next to Parks/Recreation Areas. You should then see Zion outlined in green. Zoom out so that you can see the entire layout of Zion in the view.
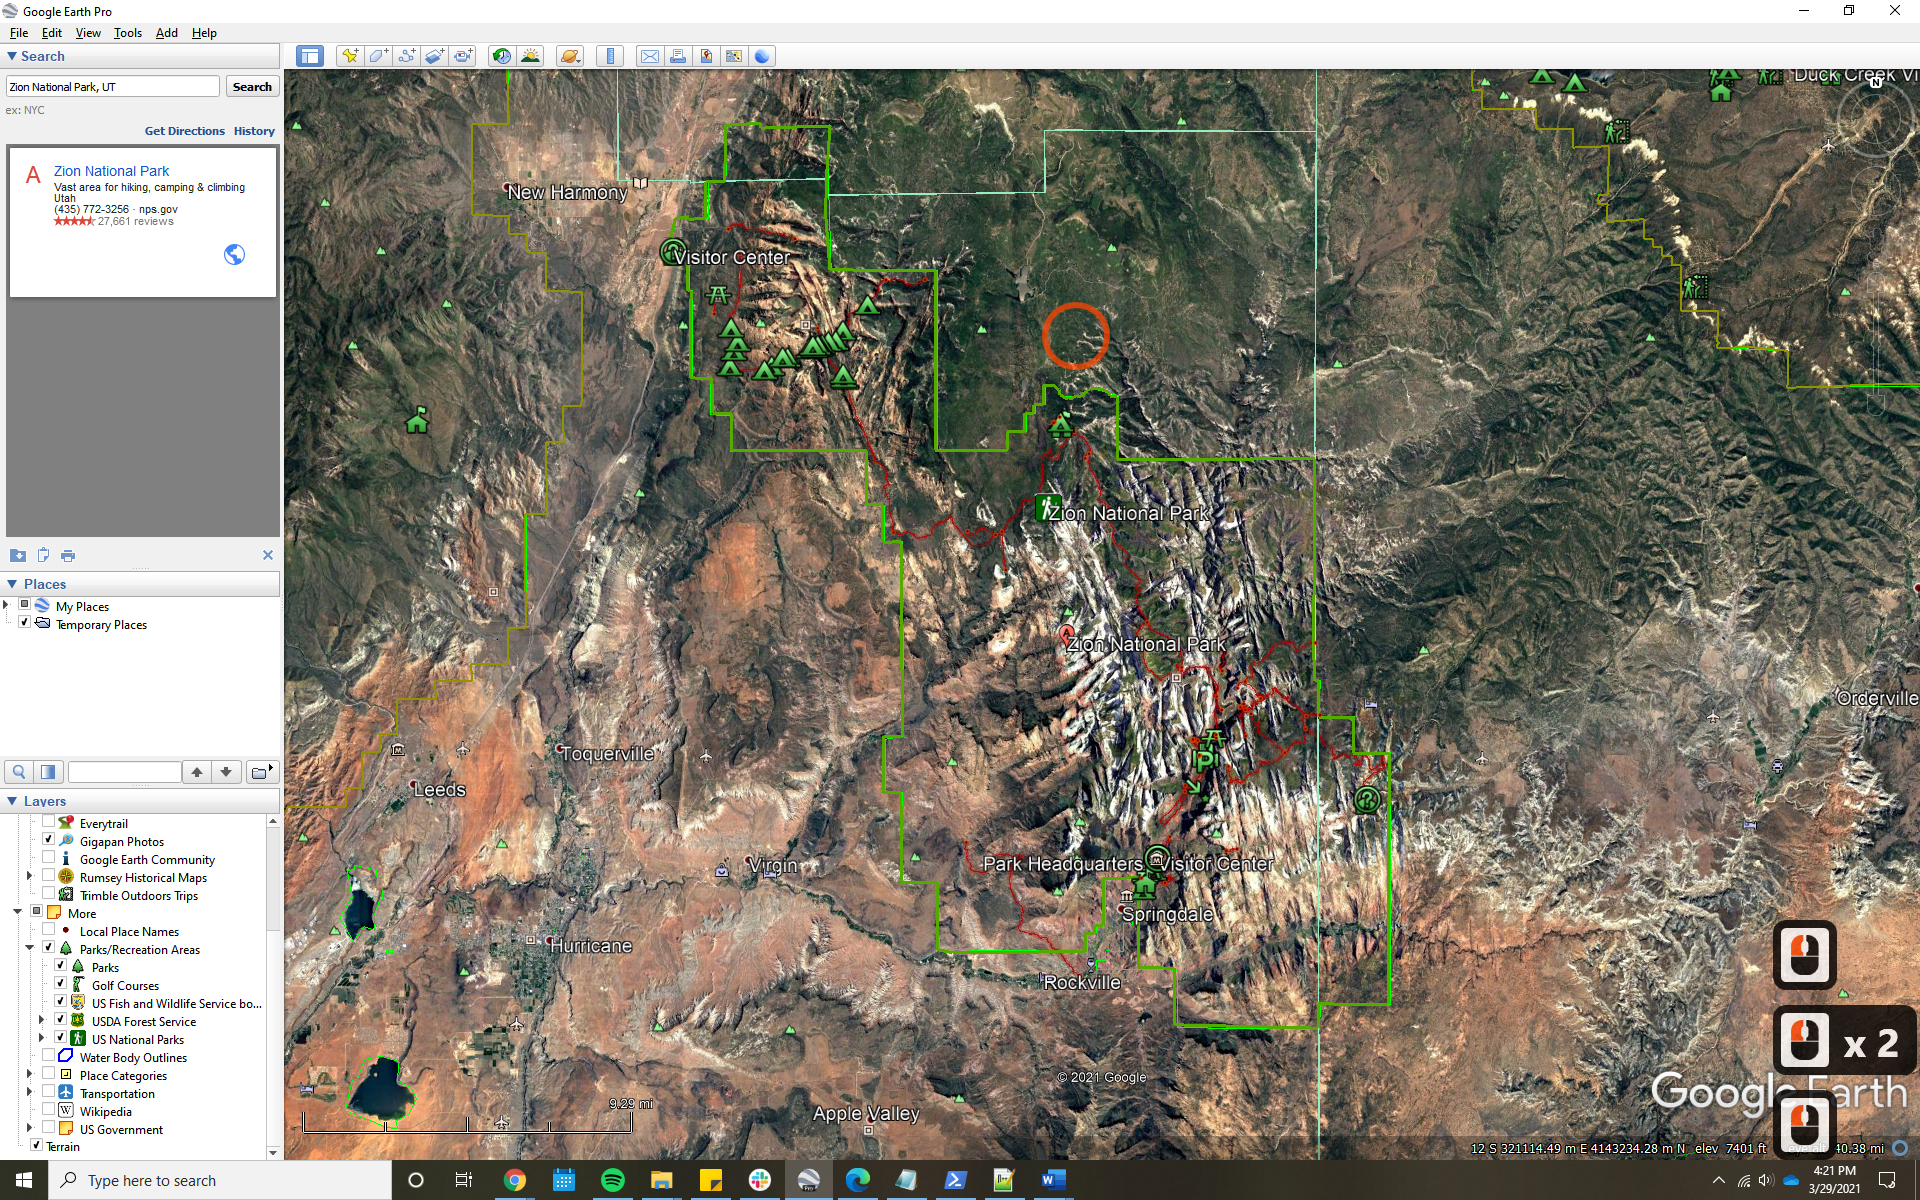
- You see a question mark symbol labeled Visitor Center next to a label Park Headquarters. Center the view on this area of Zion and scroll in so your view tilts into a perspective from which you can see the sides of the mountains and canyons in Zion in pseudo-3D.
There are two references to heights or elevation values in the bottom portion of the view:
- The heading marked “elev” shows the height of the terrain model (that is, the height above the vertical datum) where the cursor is placed.
- The heading marked “Eye alt” shows GEP’s measurement for how high above the terrain (or the vertical datum) your vantage point is.
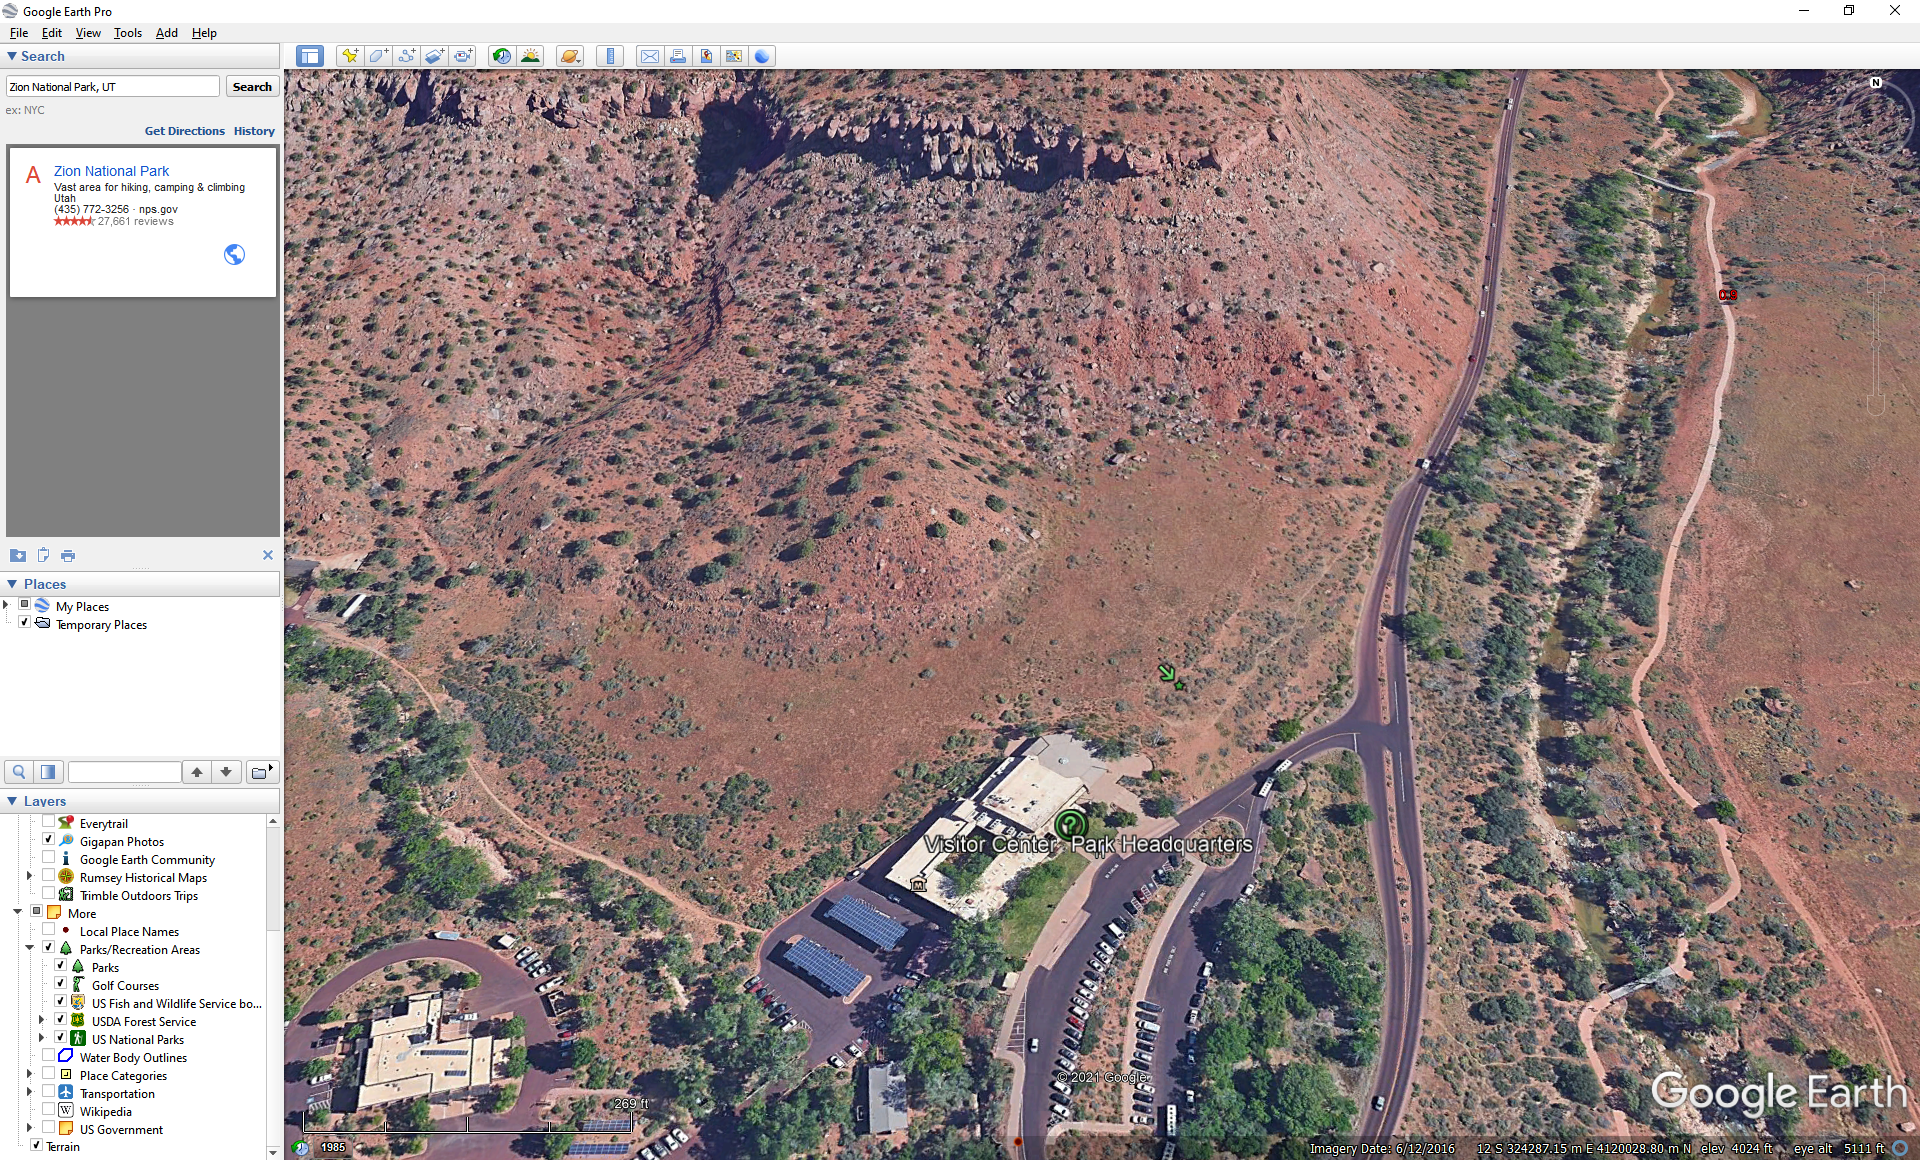
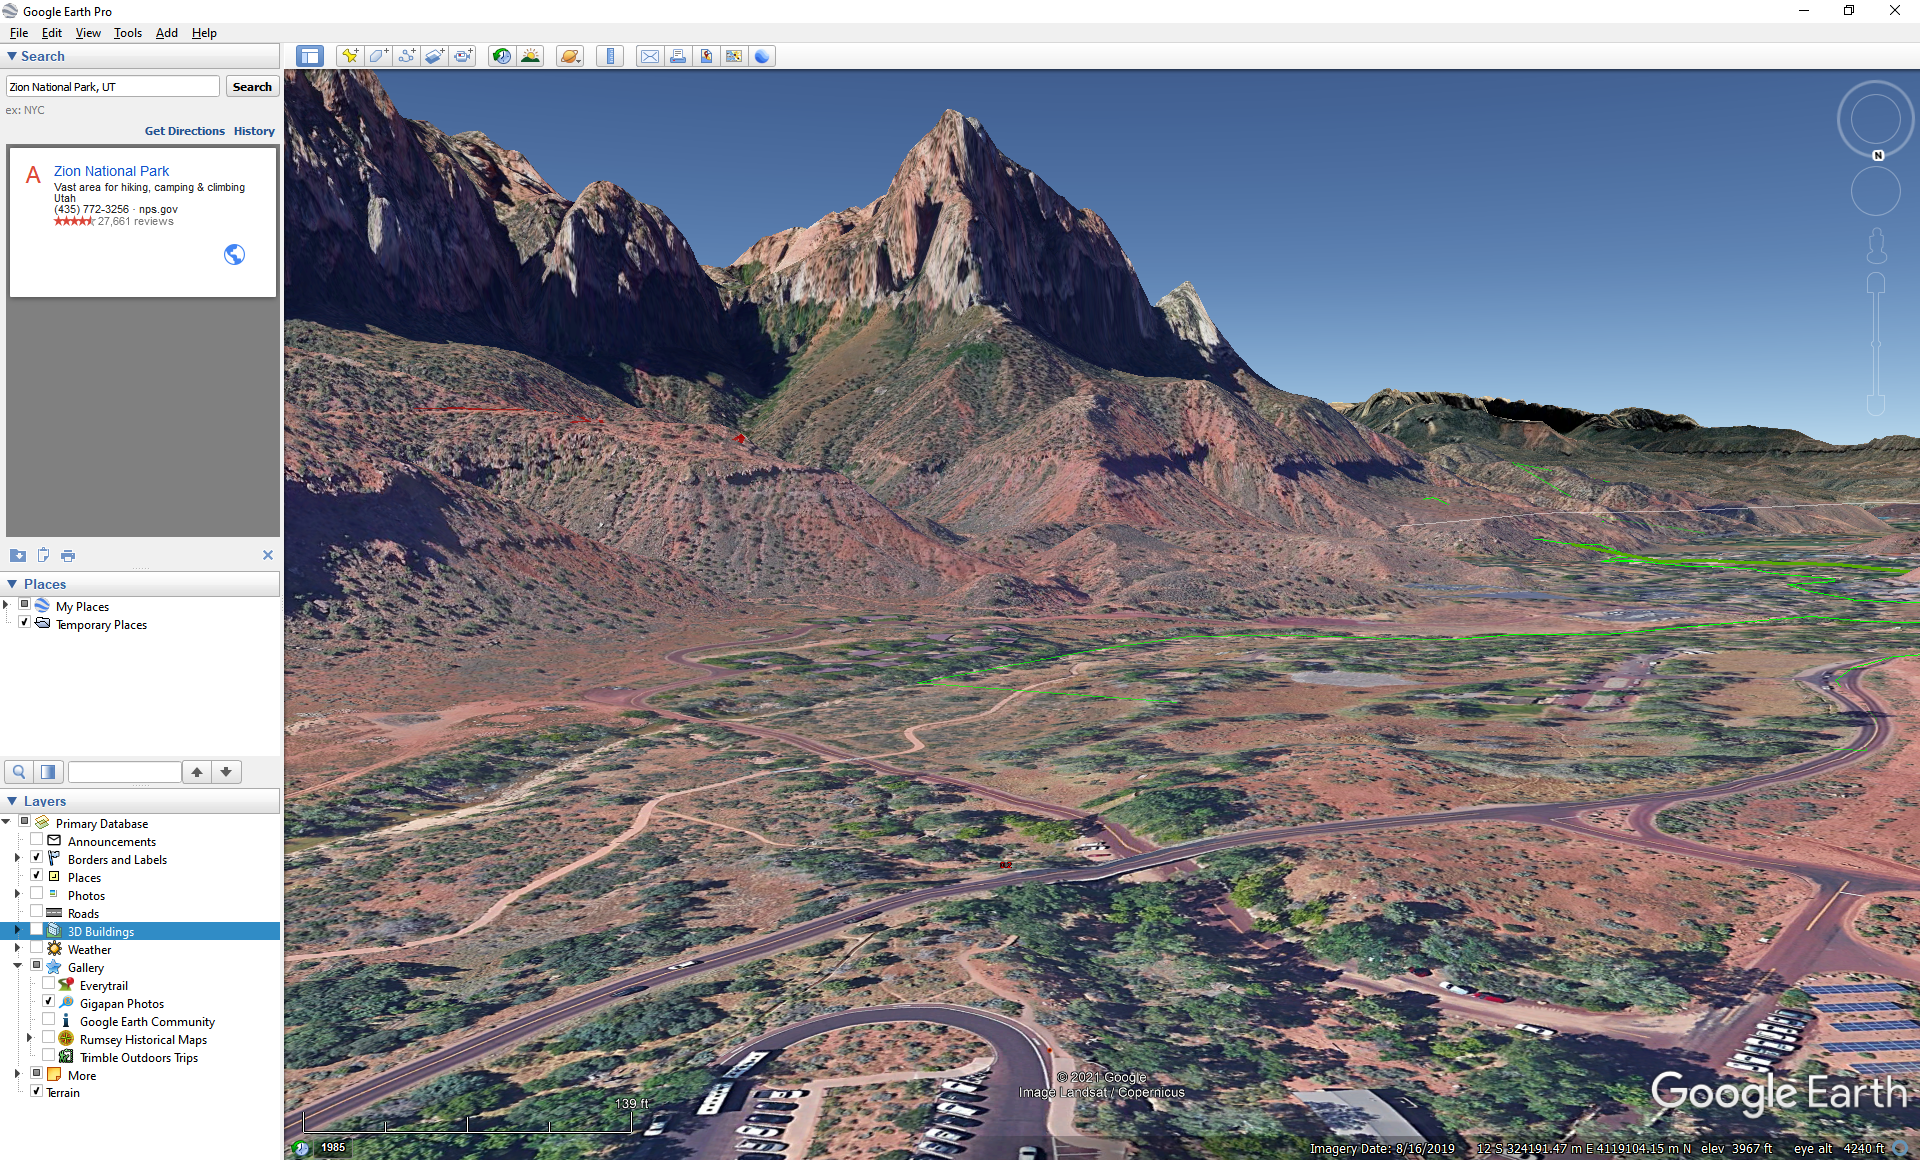
- Use a combination of your mouse wheel and the Ctrl key to maneuver yourself into a southward facing direction at ~4200 ft, positioned just above the visitor center as shown below. Use this view to answer question 1.
Question 1
How does the pseudo-3D view from this position and altitude aid in bringing out the terrain features of Zion (compared to what you originally saw in the overhead view)?
GEP allows you to alter the vertical exaggeration of the terrain layer. Vertical exaggeration changes the vertical scale but keeps the horizontal scale the same. This effect makes it easier to identify topographic variations, but distorts reality (more so than is already distorted through the computer screen) Therefore, it should be used for visualization purposes only. In GEP the settings to change this are located in the To look at different levels of vertical exaggeration by clicking Tools > Options.
- In the box marked Elevation Exaggeration, you can type a value (between 0.01 and 3) to vertically exaggerate GEP’s terrain. Play around, and then type a value of “2”, click Apply and OK, and then reexamine the area surrounding the park headquarters in Zion. Use this process to answer questions 2 and 3.
Question 2
How did the vertical exaggeration value of 2 affect the view of Zion?
Question 3
Try the following values for vertical exaggeration: 0.5, 1, and 3. How did each value affect the visualization of the terrain? In addition to the value of 2 you examined in Question 13.2, which value of vertical exaggeration was the most useful for a visual representation of Zion and why?
- Reset the Elevation Exaggeration to a value of “1” when you’re done.
- From here, you’ll examine the elevation values of the terrain surface. Wherever you move the cursor on the screen, a new value for elevation is shown in the elevation at the bottom of the view. By zooming and placing the cursor on its symbol on a spot on the screen, you can determine the elevation value for that location.
Question 4
At what elevation is the height of the park headquarters/visitor center?
Now that you have a pretty good idea of how the landscape of Zion looks in the areas near the park headquarters, you can create a viewshed that will allow you to see what is visible and what is blocked from sight at a certain location. To begin, you’ll see what areas of Zion can be seen and cannot be seen from the park headquarters. Zoom in closely on the question mark symbol that GEP uses to mark the park headquarters. This symbol is what you’ll use as the location for creating a viewshed.
- Click the Add Placemark icon on the toolbar and put the placemark right on the park headquarters question mark symbol (Review Lab 1 if you need a quick refresher). Name this new placemark “Park HQ”.
- In the Places box, right-click the new Park HQ placemark and select Show Viewshed. If prompted about the placemark being too low, click on Adjust automatically.
- GEP will compute the viewshed. Zoom out a bit until you can see the extent of the viewshed; all of the areas covered in green are the places that can be seen from the location of the Park HQ placemark and the areas not in green cannot be seen from there. After zooming out, look at the areas immediately south and southeast of the Park HQ placemark to help you answer question 5.
Question 5
Can the ranger station, the campground, or the two picnic areas just south and southeast of the park headquarters be seen from the Park HQ vantage point?
- Click on Exit viewshed (in the upper left corner of the map) to remove the viewshed layer.
- About 2 miles to the northeast of the park headquarters is a scenic overlook. Its symbol in GEP is a small green arrow pointing to a green star. Move over to that location so that you can see it in the view and zoom in closely on the overlook symbol.
- Put a new placemark directly on the green star and name this placemark “Zion Overlook”.
- Create a viewshed for the Zion Overlook point and answer Questions 6 and 7. Exit the viewshed when you’re done.
Question 6
Can the area labeled as parking to the immediate north of your Zion Overlook point be seen from the overlook?
Question 7
What is blocking your view of the Sand Beach trail from the overlook? Be specific in your answer. Hint: You may want to zoom in closely to your Zion Overlook placemark and position the view as if you were standing at that spot and looking in the direction of the Sand Beach trail.
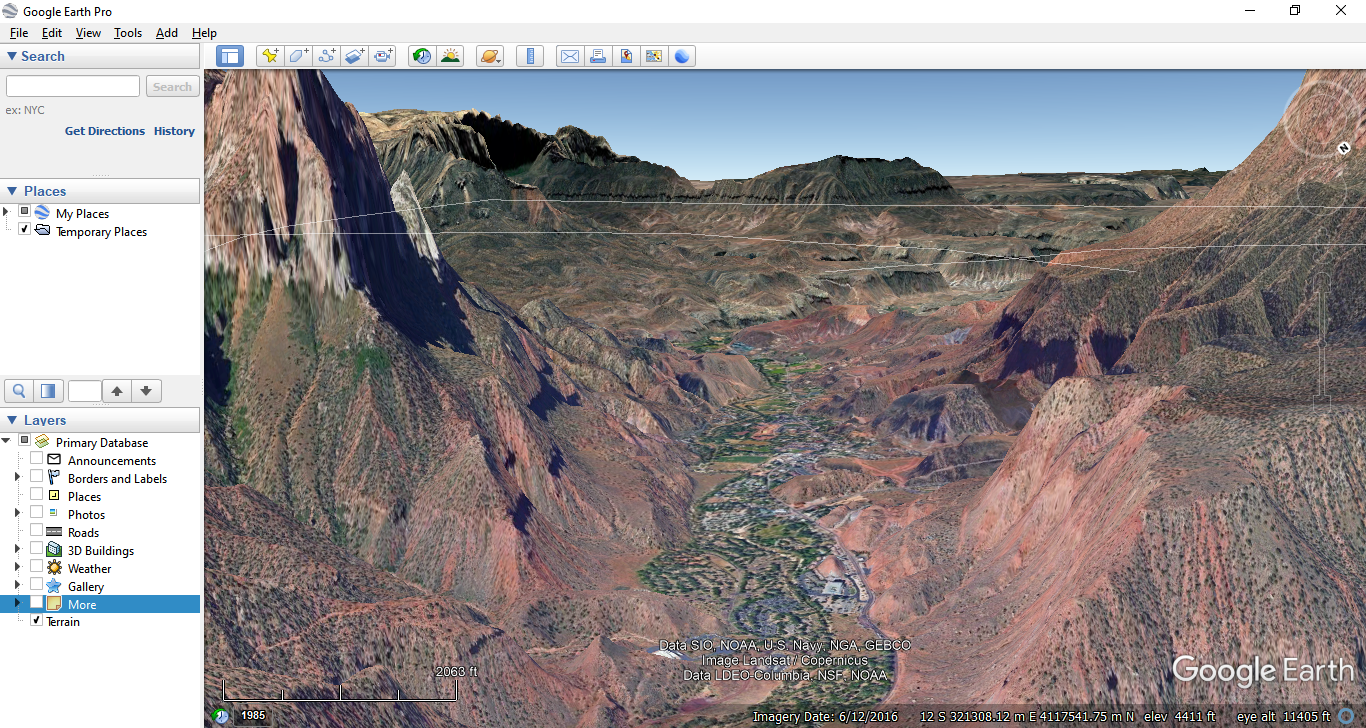
GEP allows you to record high-definition videos of the areas you view. In this section, you’ll be capturing a video of the high-resolution imagery draped over the terrain to record a virtual tour of a section of Zion. Before recording, use the mouse and the Move tools to practice flying around the Zion area. You can fly over the terrain, dip in and out of valleys, and skim over the mountaintops. Don’t forget that you can also hold down the Ctrl key and move the mouse to tilt your view. It’s important to have a good feel of the controls, as any movements within the view will be recorded to the video. Therefore, the first few steps take you through a dry run. When you feel confident in your ability to fly over 3D terrain in Google Earth Pro, move on to the next step.
- The tour you will be recording will start at the park headquarters (your Park HQ placemark), move to the scenic overlook (your Zion Overlook placemark), and then finish at the lodging/parking area about a mile to the north of the overlook. Do a short dry run of this before you record. To begin, double-click on the Park HQ placemark in the Places box, and the view shifts there.
- Double-click on the Zion Overlook placemark in the Places box, and the view jumps to there.
- Use the mouse and Move tools to fly manually over the terrain a mile north of the overlook to the parking and lodging area and end the tour there.
- If you needed, prior to recording repeat this dry run maneuvering among the three points until you feel comfortable. When you’re ready to make your tour video, double-click on the Park HQ placemark in the Places box to return to the starting point of the tour. Also, take away the checkmarks next to the Park HQ and Zion Overlook placemarks in the Places box so that the two placemarks will not appear in the view (and thus not appear in the video) and so all you will see is the GEP imagery and terrain.
- On Google Earth’s toolbar, select the Record a Tour button. A new set of controls appears at the bottom of the view:
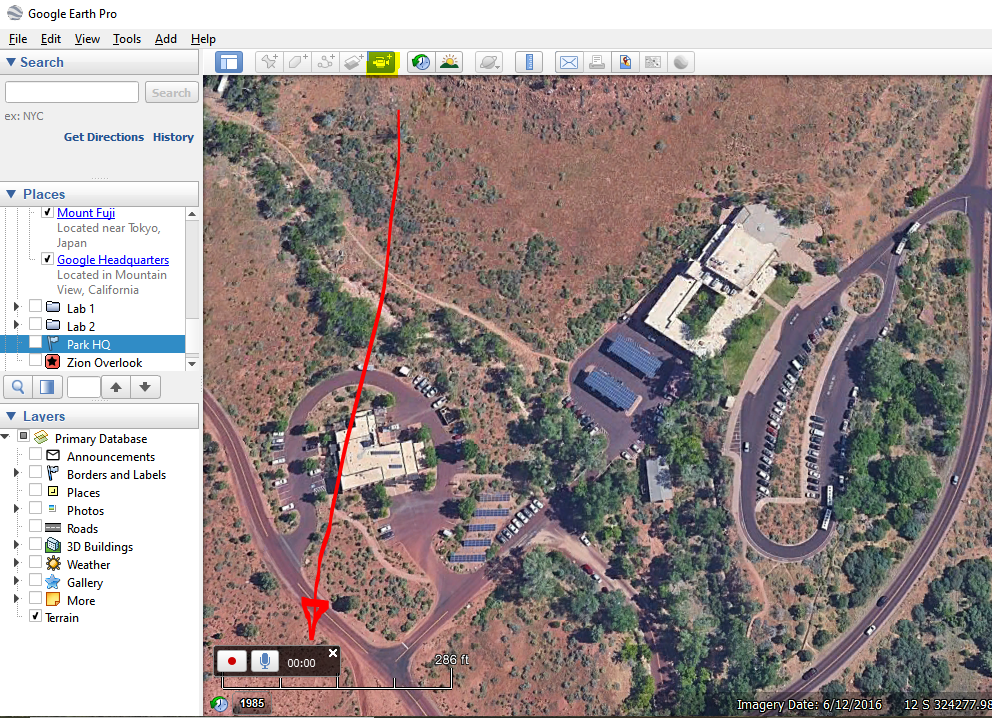
- To start recording the video, click the circular red record button.
If you have a microphone hooked up to your computer, you can get really creative and narrate your tour; your narration or sounds will be saved along with your video.
- After showing the park headquarters in the view for a couple seconds, double-click on the Zion Overlook placemark in the Places box to jump to there. Show the overlook for a few seconds and then use the mouse and move commands to fly to the lodging/parking area to the north.
- When you’re done, click the circular red record button again to stop recording.
- A new set of controls appears at the bottom of the screen, and Google Earth Pro begins to play your video.
- Use the rewind and fast-forward buttons to skip around in the video, and also use the play/pause button to start or stop. You can click the button with the two arrows to repeat the tour or put it on a loop to keep playing.
- Once you’ve created a tour you are happy with, save it by clicking the Save Tour button. Call it “Ziontour” in the dialog box that opens. The saved tour is then added to your Places box (just like all the other GEP layers).
- Right now, the tour can only be played in GEP. You’ll want to export your tour to a high-definition video that can be watched by others or shared on the Web.
- To start this process, first close the DVR control box in the view by clicking on the x in the upper-right corner of the controls.
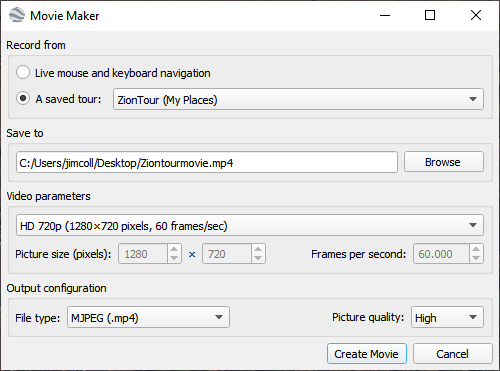
- Next, from the Tools pull-down menu, select Movie Maker.
- In the Movie Maker dialog box, choose 1280 × 720 (HD) for Video parameters to create a high-definition (HD) video of your tour.
- Next, under Record from choose the radio button for A saved tour and choose Ziontour (My Places). This will be the source of your video.
- From the pull-down menu next to File type, choose MJPEG (.mp4).
- Under Save to, use the browse button to navigate to the drive to which you want to save your video and call it “Ziontourmovie”.
- Leave the other defaults alone and click Create Movie. A dialog box appears, showing the conversion process involved in creating your video.
Return to the folder where you saved your movie and view it by using your computer’s media player.
Question 8
Submit the final video file of your video tour of Zion to your instructor, who will check it over for its quality and completeness for you to get credit for this question.
- Now let’s examine some profiles of the digital terrain model and find the slope information. To begin, return the view to the Park HQ placemark and zoom out so that you can see both the Park HQ and the Zion Overlook placemarks clearly in the view.
- To examine the terrain profile, you must first draw a path between the two points. Click the ruler tool on the GEP toolbar, and in the dialog box that opens, select the Path tab.
- In the view, you’ll see that your cursor has changed to a crosshairs symbol. click once on the Park HQ placemark location and then click once on the Zion Overlook placemark position. You should see a yellow line drawn between them, and the length of this line is shown in the Ruler dialog box.
- In the Ruler dialog box, click Save.
- A new dialog box opens, allowing you to name this path that you’ve drawn. Call it “ParkHQOverlookPath” and click OK in the naming dialog box.
- You see a new item called ParkHQOverlookPath added to the Places box. Right-click on it and select Show Elevation Profile.
- A new window opens below the view, showing the elevation profile between the two points. This profile shows you, in two dimensions, the outline and elevations of the terrain in between the two points.
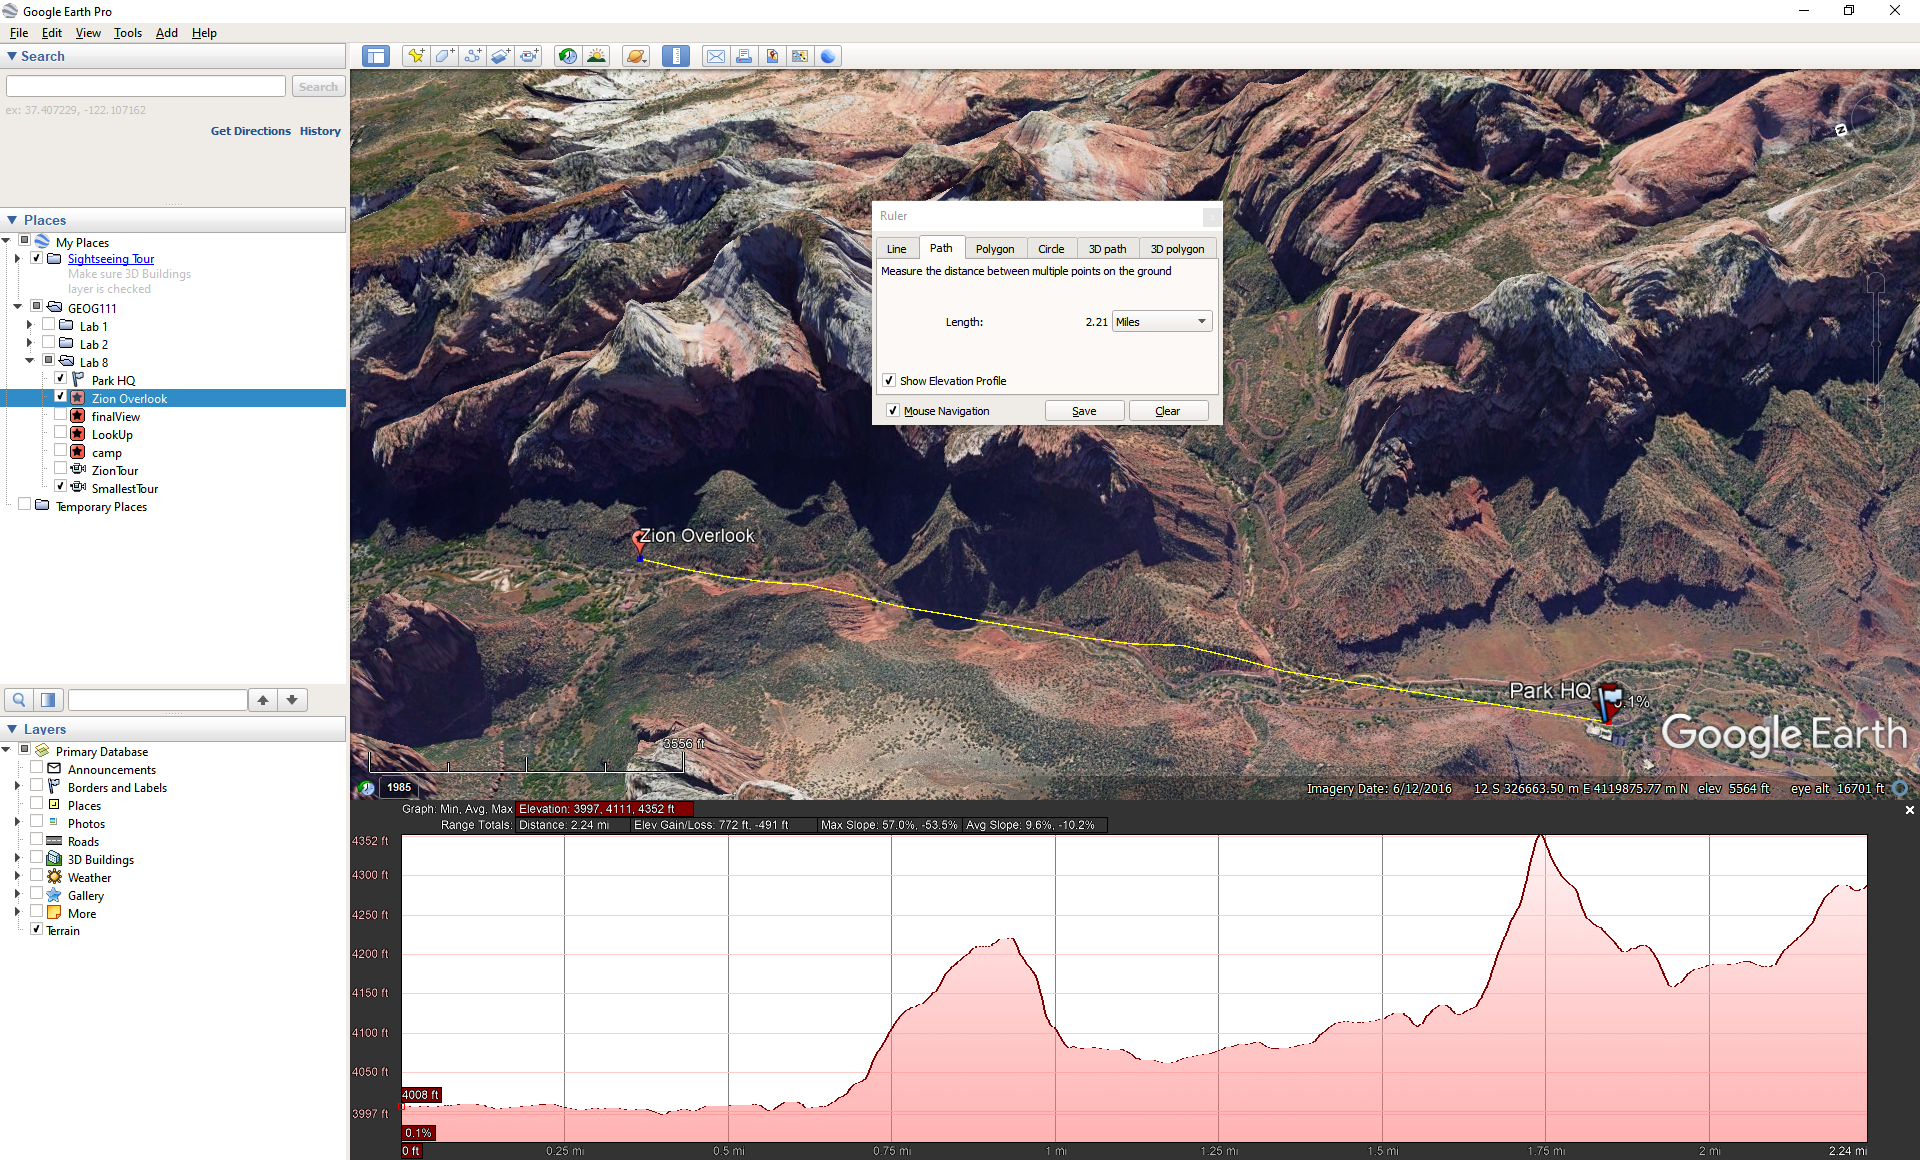
- As you move your cursor along the outline of the terrain in the profile, information appears about the elevation and the slope at the location of your cursor. You also see the corresponding location highlighted in the view. The slope information is a positive percentage as you move uphill from the park headquarters to the overlook and a negative percentage as you move downhill. Carefully examine the profile (and the digital terrain) and answer Questions 9 - 11.
Question 9
What is the average slope for the 2.2-mile path between the park headquarters and the overlook (both uphill and downhill)?
Question 10
What is the steepest uphill slope between the two points, and where is it located?
Question 11
What is the steepest downhill slope between the two points, and where is this located?
- Select a small section of the path and examine only the profile of that small subset. To do so, click the mouse at a place in the profile where you want to begin. Hold down the left mouse button and move the mouse to the place in the profile where you want to end. Release the mouse button, and you see that small section of the profile you chose in a darker red. Statistics for the elevation and slope of that subset are shown in a red box at the top of the profile.
- To examine one small part of the profile, on the far right side of the profile (the terrain nearest the overlook), you can see that a section of the landscape drops off sharply. (This should be around the 1.6-mile mark between the Park HQ and the overlook.) Using the method described above, highlight the subset of the profile from the location at the bottom of the drop-off to the overlook and then answer
Question 12
For this section of the terrain, what is the maximum uphill and downhill slope? What is the average uphill and downhill slope?
There is no need to save anything from this lab, so when done you can simply close without saving. Submit your answers to the questions on blackboard.
In lab 9 (~two weeks from now) we will use Google Earth Engine. This platform is still a beta product, and you will need to request access through your Google account here. These are still approved by hand and may take a few days to get. Once approved, you will need to follow the instructions in the email that is sent before you are able to access the platform. Therefore, be sure to do this step before you attempt to work though lab 9.