Lab - Maps & Aerial Photography
This lab provides an introduction on how to use Google Earth Pro and will help familiarize you with many of its features. Although we’ll touch on several more advanced software as the class moves on, Google Earth Pro is a really fast and useful arrow to have in your quiver and we’ll be back to use it more than once. The steps and analyses we’ll do in this introductory lab are pretty basic but foundational, and we’ll build on these as we move forward. The goals for you to take away from this lab are:
- Familiarize yourself with the Google Earth Pro (GEP) environment, basic functionality, and navigation using the software
- Use different GEP layers and features
Outline:
Materials USGS Lawrence East quadrangle Aerial photo 8900-67 Grid Overlay Aerial photo #35
| Data Name | Description |
|---|---|
| GEOG111_Lab2Questions.docx | Handout to turn in |
Topographic maps use a variety of symbols to represent human and physical features. The feature that distinguishes a topographic map from any other type of map are contour lines that show lines of equal elevation. This method proves to be a highly effective way of portraying three-dimensional landforms on a two-dimensional piece of paper. In addition, several different coordinate systems are shown on topographic maps. In addition to latitude and longitude, the base coordinates for the map, these maps show UTM grids, USPLS, and others. The wide range of information provided by topographic maps make them extremely useful to professional and recreational map users alike – they are used for a wide variety of tasks such as engineering, energy exploration, natural resource conservation, environmental management, public works design, commercial and residential planning, and outdoor activities like hiking, camping, and fishing.
Use the following guidelines in order to read topographic maps:
- The title is located in the upper right and lower left of the map sheet
- The map scale is displayed in the center bottom portion of the map sheet in the form of a representative fraction. Therefore, if the scale is 1:24,000, then each inch on the map is equivalent to 24,000 inches on the ground
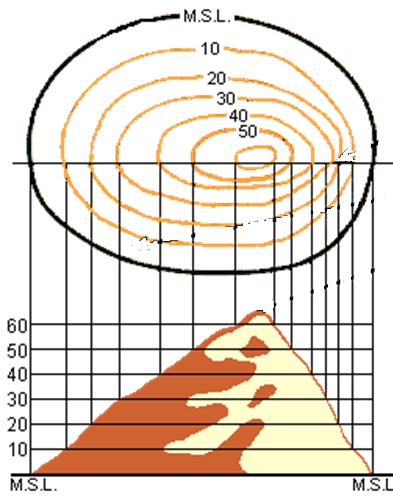
- Thin brown lines represent contours (points of equal elevation). The closer together they are, the steeper the terrain.
- Contour lines form ‘V’ shapes in valleys or along stream beds; the point of the ‘V’ points uphill
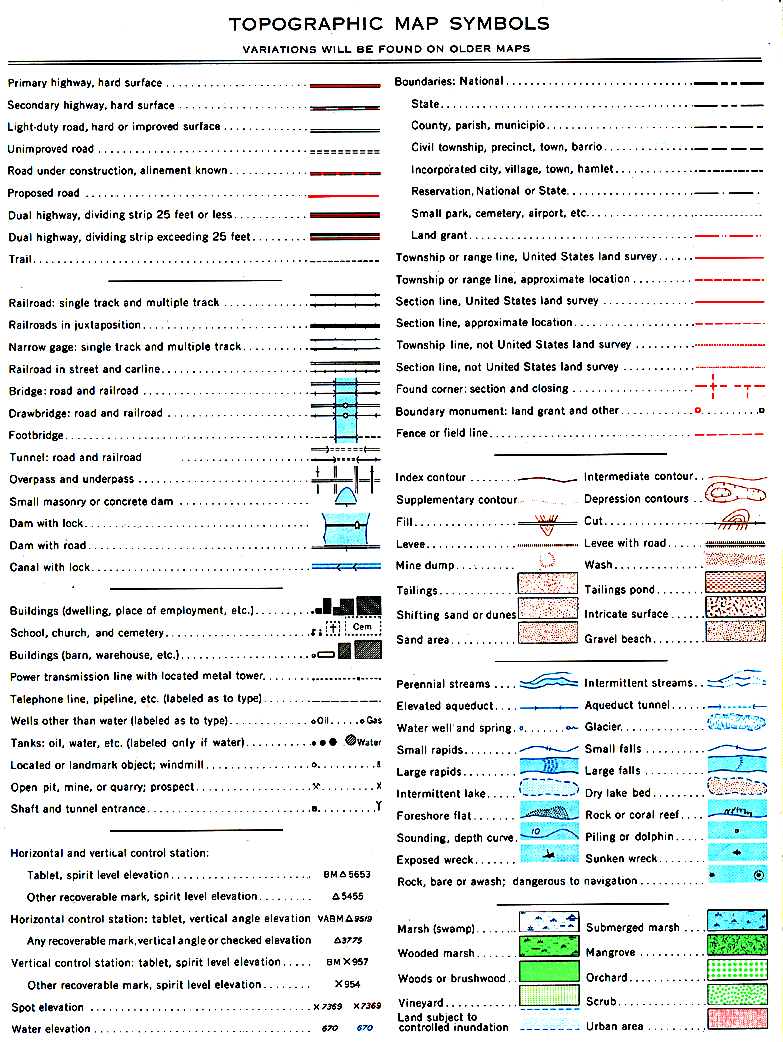
- Information concerning the meaning of colors and patterns can be found in the legend and on the Topographic Mapping Symbols handout. Generally –
- Blue – hydrologic features
- Green – vegetation
- Red – important roads, urban areas, survey & fence lines
- Black – roads, buildings names
- Purple – photorevisions and/or additions to original publication
- White – cleared woodland
- Brown – contours, sand areas
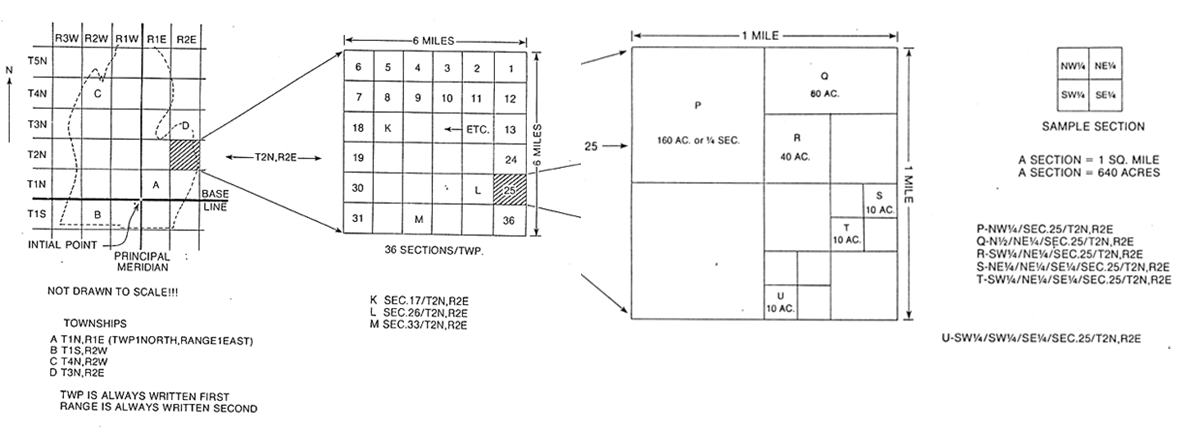
- also referred to as the township and range system
- Ranges run vertically while townships run horizontally
- Each township = 36mi2 and is divided into 36 (1mi2, 640 acre) numbered sections
- Refer to the following diagrams in order to understand the correction notation of the USPLS system
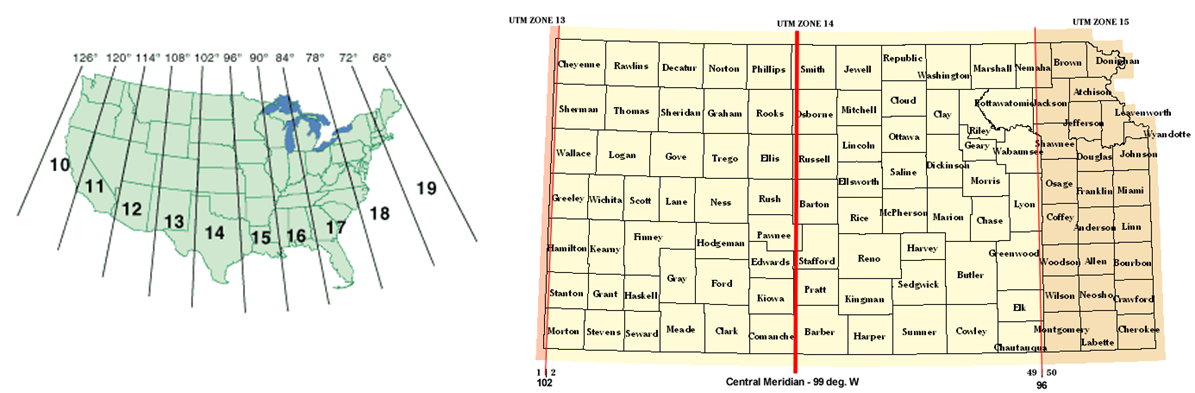
UTM coordinates simply measure in meters east and north from two perpendicular reference baselines. Coordinates are written along the sides of a map designating specific grid lines or tic marks.
- Globe broken down into 60 zones beginning at International Date Line (1800)
- Each zone is 60 wide (Lawrence in zone 15; majority of Kansas in zone 14)
- Measured in northings (how far north of equator) and eastings (how far east of zone boundary)
- Tic marks appear in blue along the side of the map sheet and are 1,000 m apart; abbreviated as follows on map: 425 = 425,000m
- Typical format for expressing UTM location: 4,308,500m N, 311,000m E
- All points on the same contour are at the same elevation above sea level
- All successive contours are the same vertical distance apart; this distance is know as the contour interval
- Every 5th contour line is printed heavier, marked with its elevation, and called an index contour
- Contour lines never intersect (except on vertical cliffs)
- Spacing dependent on slope characteristics – the steeper the slope, the closer the contour lines
- Irregular, jagged contours indicate rough terrain
- Concept relates to the amount of land area shown on the map relative to the size of paper the map is on
- Determines the level of detail (# features, size of features)
- Large scale – small surface area in great detail; features appear large (1:50,000)
- Small scale – large surface area in limited detail; features appear small (1:250,000)
Air Photo Interpretation
- Advantages – no omission of data; perspective; cheap
- Disadvantages – too much detail makes it difficult to interpret; distortion; shadow
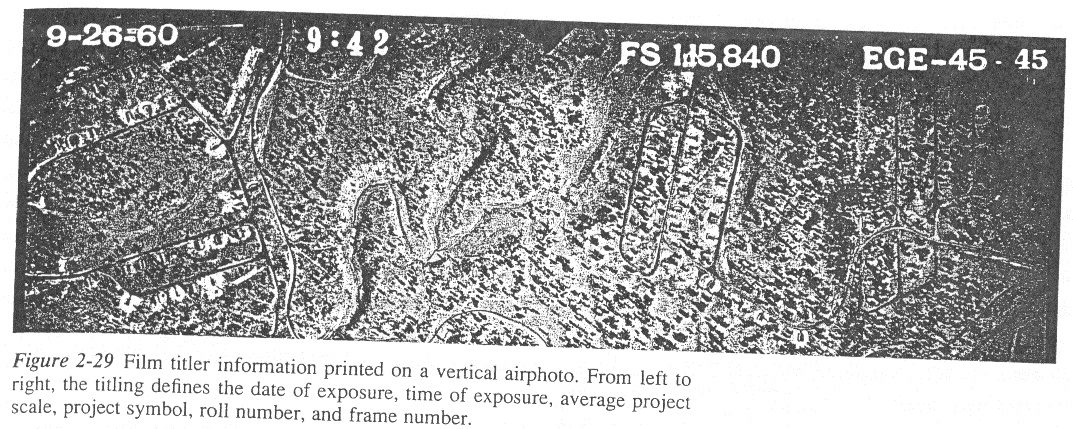
- Marginal information on an aerial photo (sometimes in gauge format or in numeric format - see aerial photo nomenclature handout)
- Date (top L)
- ID#s (photo #, mission #)
- Altitude
- Focal length
- Level
- Fiducial marks
- shape – external form
- association – context
- tone – spectral reflectance; lightness/darkness
- texture – frequency of tonal change; roughness/smoothness
- shadow – reveal or hide information; provides sun angle info
- pattern – overall spatial form; arrangement into distinctive form
- size – large/small; absolute/relative
- site – location in relation to environment; topographic position
Degrees are divided into minutes & seconds as follows:
- 10 = 60 min (60’)
- 1’ = 60 sec (60”)
- Topo map covers 7.5 minutes of area
- Lat/long given in 2.5 minute intervals on sides
- Calculating latitude and longitude requires interpolation; see the following example in order to answer Part 1, Number 2 and 3
Interpolation (Calculating Lat/Long)
- Find feature at given lat/long designation Ex: what is located at 38057’29” N and 95017’20” W?
Part 1 Obtain the United States Geological Survey (USGS) 7.5 minute topographic maps of the Lawrence East quadrangle, 1967 and 1978 editions.
-
What is the Section-Township-Range description for Memorial Hospital? (Be sure to reference the Lab 01 Guide in order to give the designation in the proper format i.e. Section, Township, Range). (1 point)
-
What is the Section-Township-Range description for Haskell Institute? (Be sure to reference the Lab 01 Guide in order to give the designation in the proper format). (1 point)
-
Approximate the latitude and longitude coordinates for the Lincoln School in degrees, minutes and seconds. (**Show your work here) (2 points)
-
What feature is located at 3854'15" N, 9510'57"W? (**Show your work here. Name the feature and its location as ‘x’ in N or S of the closest Latitude, ‘x’ in E or W of ‘the closest Longitude’) (2 points)
-
The Coal Creek runs from south to the north across the bottom of the map. If you wished to take water samples five miles further upstream, what adjacent map sheet would you want to acquire? (1 point)
-
In Section 22, T.13S, R.20E is the Blue Mound, a famous landmark on the Oregon Trail. What is the elevation at the top of the mound? (1 point)
0.7 miles southeast of Blue Mound is another hill. What is the elevation of its highest contour? (1 point)
What are the UTM coordinates (unabbreviated) for the top of Blue Mound? (2 points)
-
Locate the Union-Pacific and Atchison Topeka & Santa Fe railroad lines on the map. Briefly explain why the railroad engineers decided to lay their tracks down in these areas? What evidence does the map provide to support your hypothesis? (2 points)
-
Some features on the map are purple in color. What does the color purple signify? (1 point)
-
Note the differences between 1967 and 1978 in Section 2, T.13S, R.20E. List two major changes: (2 points)
Part 2 Use the aerial photo 8900-67 and a grid overlay to answer the following questions.
-
Locate the area covered by the photo on the map. List four features, by name, that are especially helpful in matching the photo to the map. (4 points)
-
Two farm ponds appear in a dark tone on the northern portion of the photo. What is the Section-Township-Range designation of these ponds? (Be sure to reference the Lab 01 Guide in order to give the designation in the proper format). (1 point)
-
What land cover type is located north of the river on the east side of the photo? (1 point)
-
Lay the acetate grid over the photo so that • the origin (top left corner of cell 1-A) is positioned on the top left (NW) fiducial mark (+ mark) • the same vertical line passes through the southwest (bottom left) fiducial mark.
If you have correctly positioned the grid, the KU football stadium should be located in cell H19 (approximately). The idea here is to identify features using both the photo AND the topographic map as resources; therefore, be as specific as possible when answering. For example, if the cell contains a school and the topographic map provides the name of that specific school, use the specific name (so instead of simply answering river or school, specify what river and what school if it is provided on the topographic map). Identify the major features located in close proximity to the following grid cell coordinates: (5 points)
H-19 ___________________________________________
N-6 ___________________________________________
K-14 ___________________________________________
U-24 ___________________________________________
U-7 ___________________________________________
-
Along the north bank of the Kansas River, just east of Massachusetts Street Bridge, a land feature is represented by a purple dot pattern. Find this same feature on the aerial photo. What land feature is represented by the dot pattern? (1 point)
-
Compare the size difference between features shown on both the map and the aerial photograph. What is the scale of the map? (1 point)
1 inch =____________feet.
Of the two, which is the largest scale? (that is, which portrays the smaller ground distance per inch of map/image distance?) (1 point)
Part 3 For the following section, use aerial photo # 35. The number is located in the upper left (northwest) corner of the photo. Exercises in this part are designed to acquaint you with aerial photography annotation and terminology. Notice the difference between the position and format of the written information on the two photographs that you have used for this lab assignment. The information located around the sides of a photo is referred to as marginal information.
-
The flight line for Photo 35 is oriented in a north/south direction. The marginal information has been printed along the north margin of the photo. Note the three gauges shown along the north edge of the photo. Starting on the left side, explain the function of each gauge. (3 points)
Gauge 1 _________________________________ Gauge 2 _________________________________ Gauge 3 _________________________________ -
Provide the following information: (4 points)
Date of acquisition: ________________________
Nominal scale: ____________________________
Project code: _____________________________
Roll and Exposure Number: _________________
-
Is the scale of this photo larger than the map? (1 point) _____________________
Is it larger than 8900-67 used in Part 2? (1 point) __________________________ -
Place the grid overlay on the photo so that cell 1-A on the grid is located on the fiducial printed at the upper left corner on the photo. Make sure that the far left vertical grid line 1-A also passes through the bottom left fiducial mark. If the grid is placed correctly, cell Q-5 will fall onto the middle of the Jayhawk football stadium. With the grid properly in place, provide the correct grid cell coordinates for the following campus features: (3 points)
Lindley Hall ____________________
Kansas Union ____________________
Spencer Museum of Art ____________________
There is no need to save anything from this lab, so when done you can simply close without saving. Submit your answers to the questions on blackboard.