Lab 06 - Cost Distance, Region Groups, more Model Builder & Python
This lab is designed to further strengthen your understanding and ability to apply local, focal, and zonal operations to solve problems and comfortability with ModelBuilder, this time in the context of delineating sea level rise. In part 1, you will walk through 2 methods of using the point and click interface to accomplish your analysis. In part 2, you will use ModelBuilder to accomplish this same task, and in part 3 you will see how you can import your own python analysis into ArcMap as tools.
Lab 6: Answer Sheet
Name:
Question 1: How many pixels are inundated?
Question 2: While you’re building your models with model builder, you create several variables called model parameters that are shown with P letter next to their variables. What happens if you didn’t create those model parameters? What is the benefit of having the model parameters?
Question 3: In part 02 of the lab, list all the output layers after you Run Entire Model in the ‘InundationByRegionGroup’ model builder window.
Question 4: In part 02, how many cells does the final output have the value of ‘1’?
Question 5: Which of the two methods of delineating sea level rise, region group or cost distance, was the more efficient means of performing this analysis? Why do you think this is?
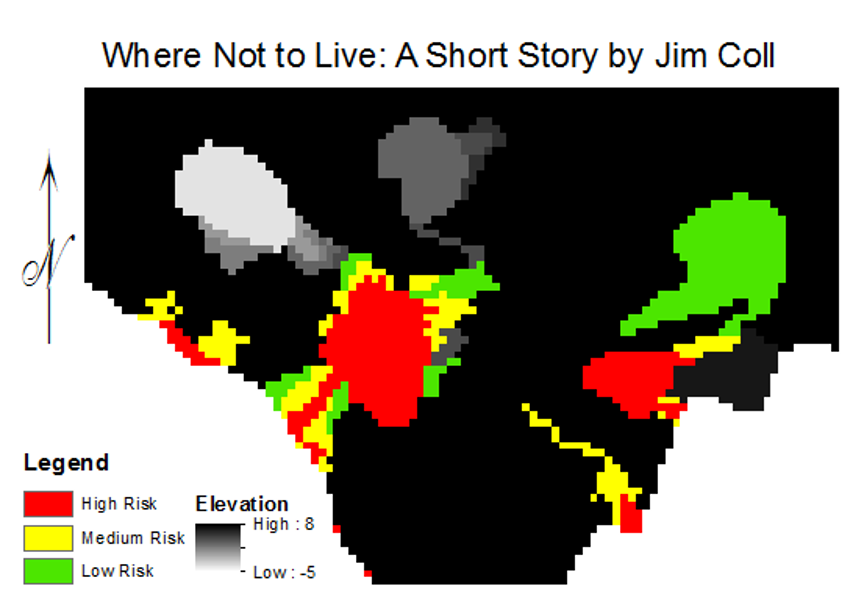
Question 6: Submit a coherent map of the output. Use mine below as an example.
Question 7: This time, double click the InundationByRegionGroupPython script tool in part 03. When the model tool dialog box is opened, fill the parameter boxes with the right layer names. Click OK to run the tool. How many output layers do you have? List them.
Question 8: In part 03 how many cells does the final output have the value of ‘1’?
Question 9: If the Sea Level Rise is set to 4, how many cells does the final output have the value of ‘1’?
| Relevant part | Data Name | Description |
|---|---|---|
| Part 1-3 | DEM | Raster dataset of the elevation of the area |
| Part 1-3 | Ocean | Raster dataset of the land cover types (Land & Ocean) over the area |
| Part 3 | SeaLevelRiseInundation.py | Sea Level Rise inundation delineation using region group and zonal max |
As you saw in class, it is possible to take two different approaches to map sea level rise in GIS. We can use cost distance to calculate the rise from an ocean source or we can use region group to get the regions of inundation which include an ocean source. Here you need to pick one of the methods and walk through it using ArcMap.
Unzip the lab 6 folder into your one drive, in it you will find folders already set up for part1, part2, and part3. Go ahead and pick a means of delineating sea level rise from below, either cost distance or region groups, and perform a 2-meter sea level rise analysis.
| Cost Distance | Region Group |
| 1. Set the oceans to a one value source | 1. Create a raster of all the areas less than the projected sea level rise. |
| a. Use the Set null tool on the ocean raster | |
| b. "Value" = 0 | a. Hint: Use the set null tool to replace all values > sea level rise to null. |
| c. Your false or constant raster can be either the ocean raster or a value of 1 | |
| b. Otherwise, set the value to 1 | |
| d. call the output “source.tif” | c. Call the output demlteslr |
| 2. Set all elevations in the DEM which are above the sea level rise threshold | 2. Group the resulting regions using region group |
| a. Use 8 connectivity and group using the within method. | |
| a. Set null tool again, this time on elevation | b. Call the output regions |
| b. "Value" > %Sea Level Rise% (in the manual case, 2) | 3. Use zonal statistics to identify the regions which contain an ocean source |
| c. Set the false raster to 1 (Friction should be the same everywhere otherwise) | |
| a. We want the value of oceans (input value raster) using the regions as the zone data, and the maximum statistics. | |
| d. Call the output “friction.tif” | |
| 3. Create the cost distance surface | b. Call the output zonemax |
| a. Cost distance tool… | 4. We then want to remove the oceans from our calculation |
| b. Cost is “friction” source is “source” | a. Hint: raster calculator (%zonemax%" - "%ocean%"). |
| c. Call the output "distance.tif" | b. Call the output diff |
| 4. Remove the source cells to create a raster of just inundation | 5. Finally, set everything less than or equal to 0 to null so that we have just the inundated pixels |
| a. Set null | a. Hint: Set null tool again |
| b. “Value” = 0 | b. Call the output SLRbyRegion |
| c. Again, set the value to 1 otherwise | |
| d. Call the output “SLRbyCost.tif” |
Answer question 1
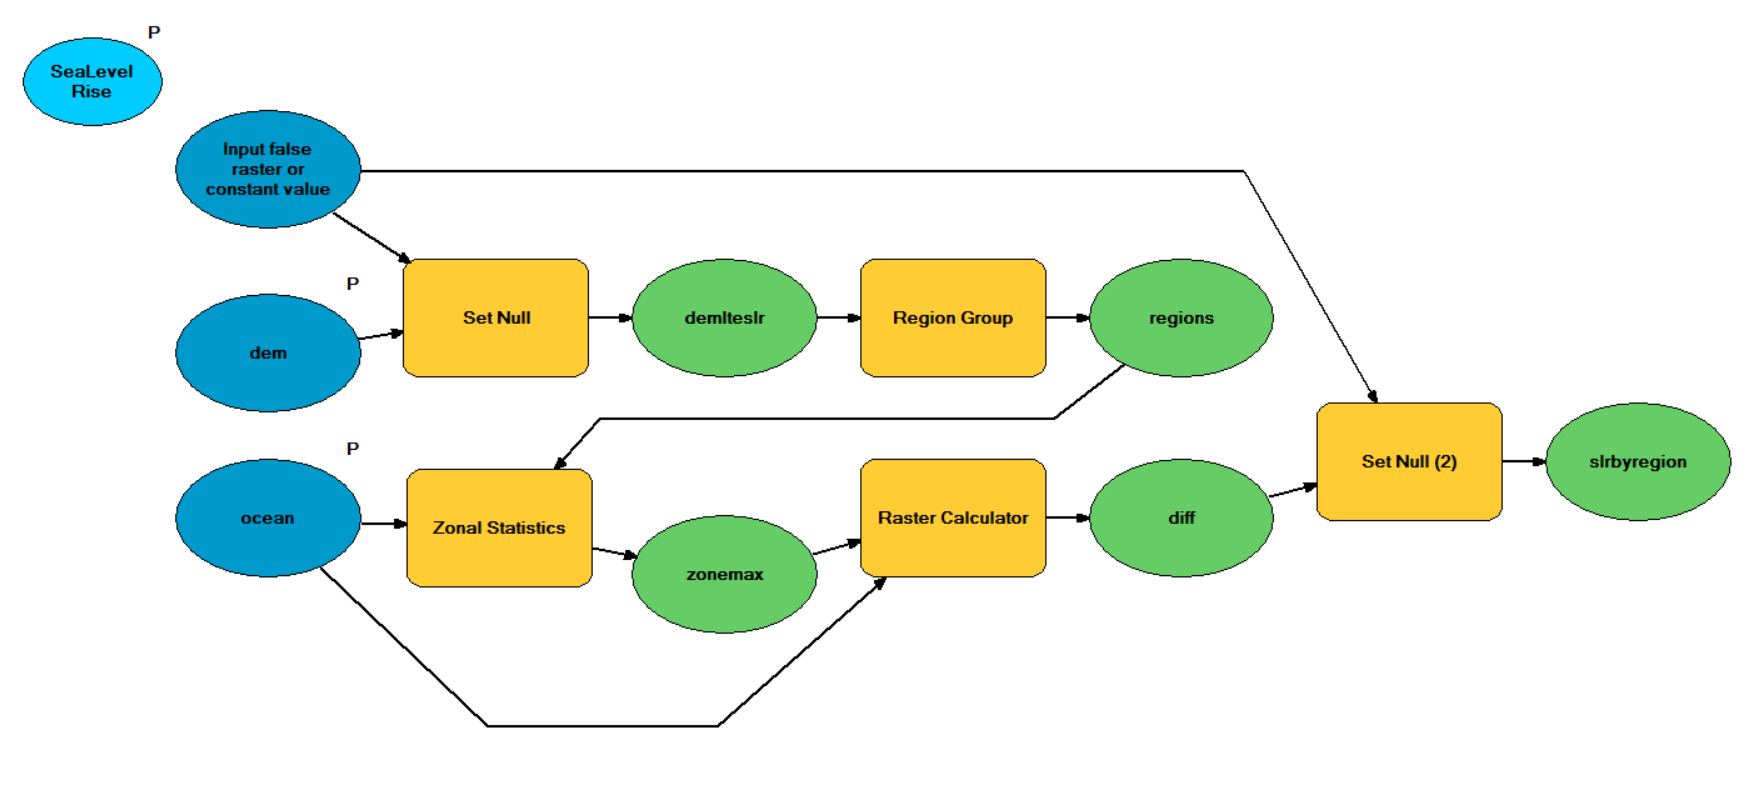
In ArcGIS we can use ModelBuilder to build a visual model that represents an analysis work flow. A ModelBuilder model typically consists of a set of data connected by a series of GIS operations. In this part we will be using ModelBuilder to create a model to delineate sea level rise inundation. Using a ModelBuilder model is helpful in situations where the model can be applied to numerous datasets, as we saw with the last lab. Here you will use model builder to create both variants of the SLR workflow, one for Region Groups and one for Cost Distance.
- In your lab 6 part 2 folder, create a new File Geodatabase.
- R-Click > New > File Geodatabase
- This will be your new default workspace
- Add in the DEM and Ocean to the ArcMap, and examine them. When done, remove them so you have a blank map.
- It will also be helpful if you set overwrite to on
- Geoprocessing > Geoprocessing Options > Overwrite the outputs…
- R-click on your lab 6 part 2 folder and create a new toolbox. Name the new toolbox InundationTools.tbx.
- R-click on the toolbox and create a new model.
- Close the Model window.
- Rename the new Model (R-click | Rename) to InundationByRegionGroup.
- Re-open the Model by R-clicking and selecting Edit…
- Set up the Model Properties by going to Model | Model Properties.
- Under the Environments tab, check the boxes for Processing Extent | Extent and for Raster Analysis | Cell Size.
- Click the Values… button.
- Click the down arrows for each of the settings and make the Extent the same as the DEM raster in your data folder, and the Cell Size the same as DEM as well (they both have the same extent and cell size, if you check the data’s properties).
- Click OK on the Environment Settings.
- Click OK on the InundationByRegionGroup Properties Window.
You will create a workflow diagram in the Model window that will show all the steps and operations/tools needed to delineate the sea level change. We start the process by dragging tools from ArcToolbox into the Model window to perform a specific operation.
- Open ArcToolbox and set up your model window and ArcMap window so that you can see both ArcToolbox and the model window at the same time.
- Add the Set Null tool by finding it under ArcToolbox (Spatial Analyst Tools | Conditional) and then dragging it onto the model window.
- Before you set the options for the Set Null tool, create a Double variable from the Insert menu. Rename it as ‘Sea Level Rise’, give the value of ‘2’ to the variable, and set it as a Model Parameter by checking Model Parameter option from its popup menu (right-click). The letter P appears beside the variable, indicating it is a model parameter.
- Double click on the Set Null tool. The Set Null dialog will open, and it should be familiar.
- We can reuse the false raster we used in the first set null.
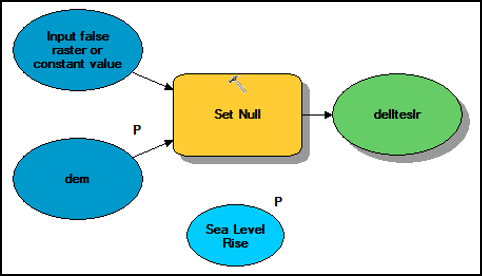
- Set the input conditional raster to DEM, and set the output to demlteslr and make sure it is saved in the appropriate place. As for the expression, type in “Value” > %Sea Level Rise%. Click OK.
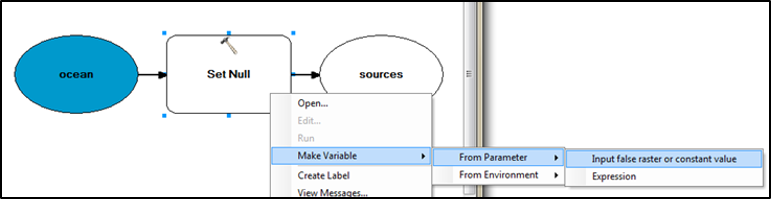
- Finally, right-click the input raster (DEM) and check Model Parameter option.
- You now have a simple model.
- Right-click the Set Null and select Run to test your model.
- Add, examine, and then remove the created Raster from the ArcMap window
- Add a Region Group tool (Spatial Analyst Tools > Generalization) to your model.
- Set demlteslr as its input raster
- Set regions as an output.
- The number of neighboring cells to use is eight and use within for zone grouping method.
- Uncheck not to add link field to output and…
- click OK to finish the Region Group dialog.
- Right-click the Region Group tool and select Run to test your model.
- Add examine, and then remove the created Raster from the ArcMap window
- Add a Zonal Statistics tool (Spatial Analyst Tools > Zonal) to your model.
- Set regions as its input
- Set VALUE as a zone field
- Use zonemax as an output.
- Set Ocean as an input value raster.
- Use maximum for statistics type, then click OK.
- Set Ocean as a model parameter.
- Right-click the Zonal Statistics and select Run to test your model.
- Add examine, and then remove the created Raster from the ArcMap window
- We now need to use the Raster Calculator to calculate the difference between the zonemax and the Ocean.
- Hint: ("%zonemax%" - “%Ocean%").
- Save the output as diff.
- Right-click the Raster Calculator and select Run to test your model.
- We are going to add a Set Null again to get our final output Inundation. Create another Double model variable, to define the input false raster or constant value and give it a value ‘1.’ Set diff as the tool’s input and type in the proper expression to query the values less and equal to zero.
- The final layout should look like so:
- Right-click the Set Null and select Run to test your model.
- Click OK and Save your model.
- While you’re building your model, you can check if each tool (so far, we created 5 tools; Set Null, Set Null(2), Region Group, Zonal Statistics, and Raster Calculator for this model) you created works fine by right-clicking and running it (select Run). This time, let’s check if whole your model runs in one go.
- Close the model.
- After all tools are correctly established in the model, delete all of the output files (delteslr, regions, zonemax, diff, inundation) from your output folder.
- Run your model using the appropriate inputs.
Create a new model using the cost distance approach to delineating sea level rise. Your final model should look something like so:
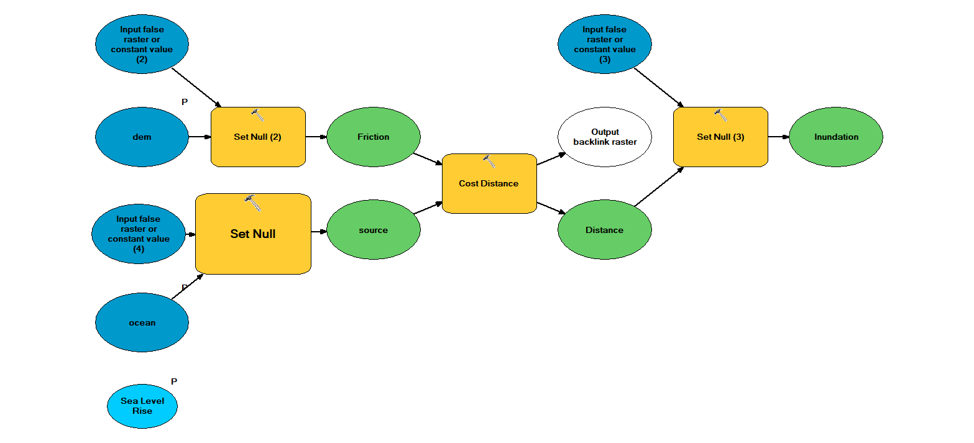
Answer question 2-5.
In this part of the lab we will be using ArcGIS Python Command Window to do the same analysis we did in the first part. The main purpose is to show how such a model/analysis can be implemented by using a python script tool. We, therefore, will practice how to create ArcGIS Python tool using a python script.
- Within ArcGIS, you can create a script tool inside a toolbox. A script tool is like any other tool - it can be opened and executed from the tool dialog box, used in models and the Python window, and called from other scripts and script tools.
- To create a script tool, you need three things; a script, a custom toolbox, and a precise definition of the parameters of your script.
- You can create your own toolbox called a custom toolbox and add tools and toolsets to it. Script and model tools that you create should be stored in a custom toolbox.
- Open ArcCatalog. In the Catalog Tree, navigate to the folder where you want the toolbox to be created.
- Right-click the folder and click New > Toolbox. Give the toolbox a new name InundationToolbox.tbx.
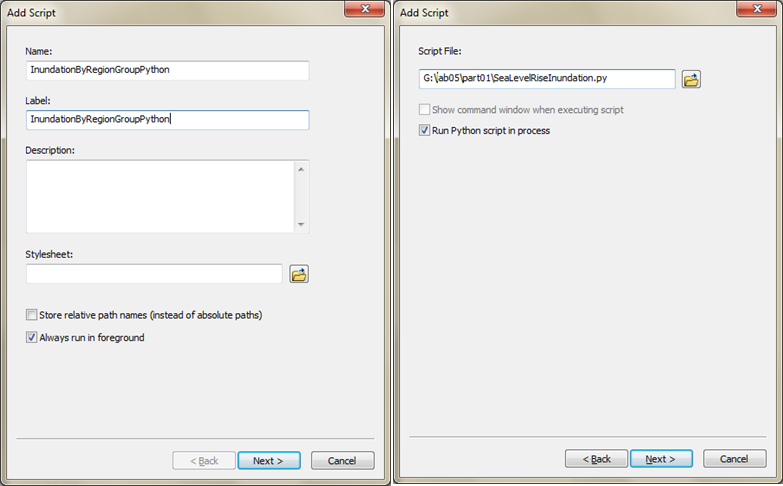
- To create a script tool, right-click your custom toolbox and click Add > Script. This opens the Add Script wizard that takes you step by step through the process of creating a script tool.
- Give a new script a name InundationByRegionGroupPython, and click next.
- Add a script file by specifying the location of the file InundationByRegionGroupPython.py.
- On the third step of the Add Script wizard, add parameters by typing the name and selecting the data type as described in the table below. As for the property, use the default options unless specifically mentioned in the table below.
| Display Name | Data Type | Property |
|---|---|---|
| Oceans | Raster Dataset | |
| DEM | Raster Dataset | |
| Sea Level Rise | Double | Default: 2 |
| Inundation | Raster Dataset | Direction: output |
- After completing the steps, your toolbox will contain a new script tool. You can always modify properties (such as parameter names and data types) of this script tool by right-clicking the script tool and choosing Properties.
- Double click the script file you just added. The InundationByRegionGroupPython tool dialog will appear and it should look like this image below.
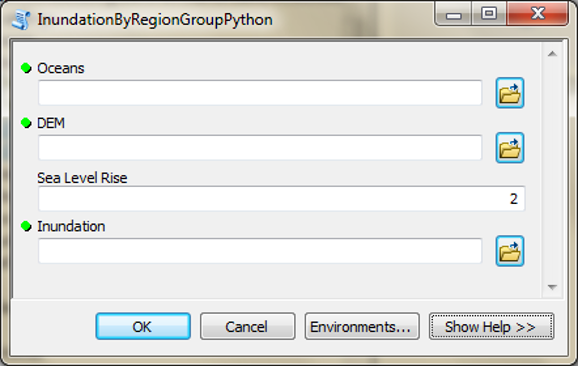
- Input ocean & dem for the first two input layers. Use the default value for Sea Level Rise. Save Inundation in your part02 folder as an output layer. Click OK to run the tool. Answer question 6-9.
When finished, submit your work to blackboard.