Lab 04 - Zonal Operations
In this lab, we are interested in assessing how much of Douglas County is covered by tornado sirens. In other words, we want to know how many people can actually hear a tornado siren when it goes off. While the sirens for Douglas County were designed to be heard at distances of up to 5,800 feet, there might be areas in which people can’t hear them. Finally, we will use the zonal definitions of lake area created in lab 3 to calculate the height of the water from the DEM and turn the height and area into a volume estimation.
Lab 4: Answer Sheet
Name:
Part 1:
Total Douglas County population:
Number of people who can hear the tornado sirens:
Number of people who cannot hear the tornado sirens:
Percentage of the population that can hear the tornado sirens:
Percentage of total population that cannot hear the tornado sirens:
Note: Your math should add up.
Part 2:
How much water did the lake gain over the time period:
Which period did the volume grow the fastest, 1995-2003 or 2003-2009?
Write a short (2-4 healthy paragraphs) analysis regarding this process. Some topics to touch on include how this analysis was performed.
- Would you expect a significantly different answer if you tweaked the methods?
- What are the sources of error in this process?
- How can we address those, and the uncertainty they add to our analysis?
| Relevant part | Data Name | Description |
|---|---|---|
| Part 1 | censusblk.shp | Census blocks for Douglas County, Kansas |
| Part 1 | kansas2000censusblk.dbf | Database file containing census data, including population per block group |
| Part 1 | sirens.shp | Point shapefile with locations of tornado sirens in Douglas County, KS |
| Part 1 | roads.shp | Douglas County Roads |
| Part 1 | countybnd.shp | Douglas County Boundary |
| Part 2 | BaseData | Data downloaded in the first lab |
| Part 2 | …LakeBoundry.tif | NDWI threshold maps for 1995, 2003, and 2009 |
- In ArcMap, create a new empty map, and save your map document to your personal folder.
- Add countybnd.shp, roads.shp, censusblk.shp, and sirens.shp from your Part1 folder to the empty arcmap.
- Create buffers around the sirens using the buffer tool and the following settings:
- Input Features: sirens
- Output Features: sirens_buffer.shp (make sure to save in your Part1 folder)
- Linear Unit: 5800 feet
- Dissolve Type: None
- Arrange layers so that you can see the siren points and buffers on top.
- Let’s remove the common polygon lines in the buffers. In ArcToolbox go to Data Management Tools | Generalization | Dissolve. Use the following settings:
- Input Features: sirens_buffer
- Output Features: sirens_buffer_dissolve.shp (make sure to save in your Part1 folder)
- Change the symbology of the layers to the colors and symbols of your choice, and arrange the layers accordingly.
Notice that you could have just used the dissolve type parameter in the buffer tool, but now you know where both are :)
- Add kansas2000censusblk.dbf to the data frame.
- Right-click the censusblk layer, select Joins and Relates, and select Join. Join the layer to kansas2000censusblk.dbf using the STFID field.
- Examine the attribute table of censusblk to make sure the join was successful. Do you see all sorts of demographic attributes? If so, the join was successful.

NOTE: Need a refresher on joins? Try lab 6 from the intro class.
- Right-click the header of the POP2000 attribute and select Statistics. The sum value is the number of people in Douglas County. Record the value somewhere, as you will be entering this into the comments section of your Blackboard submission. Close the window.
- Use Select by Location… to select the census blocks that are within the buffer zone.
- Hint: Use the are completely within the source layer feature setting. The result should be 1,590 census blocks selected.
- Find the population in these census blocks by opening the censusblk attribute table, right- clicking the POP2000 attribute header, and selecting Statistics. (It will only give you statistics on the selected records.) Record this number.
- Find the population out of the range of sirens by clicking Table Options (upper left corner of the attribute table), selecting Switch Selection, and then using the Statistics tool again. Record this number.
- Switch the selection back (i.e., back to the blocks within range of the sirens) and close the attribute table.
- Answer the part 1 questions.
Open your Lab 2 Part 1 mxd or create a data frame/document. This document should have:
- AOI shapefile.
- lake boundary classifications (…NDWI_#.TIF) )for 1995, 2003, and 2009.
- The RGB file for each year
- The elevation data
As you have already noticed, we need to isolate the lake boundary from any errant, misclassified pixels. We can do that a few different ways you can do this. For each image, redefine an AOI and use the raster clip to isolate the lake boundary. This is time consuming unsalable, and poorly reproducible. Here we will deploy a focal approach. Note that here, your numbers will differ from mine, region groups applies group numbers in a quasi-random fashion, and you may or may not have the same number of groups that I do.
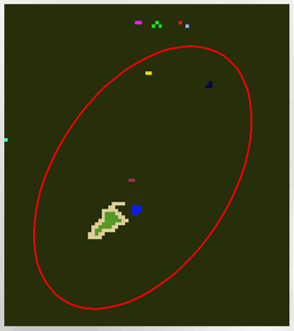
- The more preferable way to do this is to use region groups, a tool you will cover in much more depth later in the semester. For now, just know that it groups clusters of raster pixels into unique groups.
- Use the …LakeBoundary.tif as the input raster
- Save the output raster as …groups.tif
- Use Eight connectivity
- Use the identify tool to pick out the value of the lake edge
- Use the raster calculator to create a zone of just that value.
- Hint: mine looks like “LT05_L1TP_008067_19950622_20170109_01_T1_LakeBoundry_Group.TIF” == 10.
- Overwrite your lake boundary raster
We will use zonal statistics and our newly created zone to calculate the (insert statistic here) value of the elevation data.
- Use the newly created lake boundary as our zonal definition.
- We want the statistics from the elevation data.
- Choose a statistic, I chose maximum but feel free to explore other options.
- Save the output as …LakeBoundary_ZonalStat.tif
This output is the “elevation” of the water, we then need to place this value in a raster that we can subtract from the DEM to calculate a lake depth at each pixel
We need to use the same process as above to pick out just the lake.
- ("…LakeBoundry_Group.TIF" == 10) | ("…LakeBoundry_Group.TIF" == 12)
NOTE: That’s an | above, not a /. The “pipe” is computer shortcode for “OR”. Shift backslash on most keyboards.
- Save the output as …LakeRaster.tif.
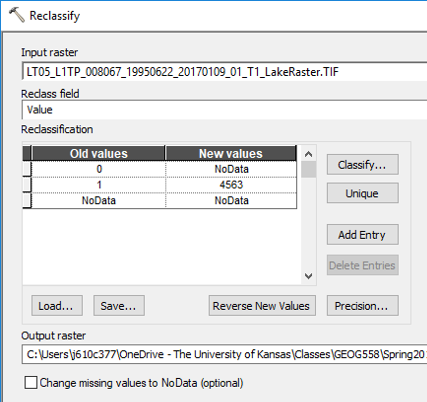
We then need to use the reclassify tool to turn the binary lake classification into a lake elevation
- Turn 0’s into NoData.
- Turn 1’s into the value of the zonal statistic output calculated in the previous step.
- Save the output as …LakeSurface.tif.
- We now need to subtract our two surfaces
- Hint: RasterCalcuator(lakeSurface – Elevation)
- Save the output as …LakeDepth.tif.
- Examine the attribute table of the subtraction grid (**R-click** on LakeDepth | **Open Attribute Table**).
- Click the **Select by Attribute** button and select cells with an elevation difference greater than 0.
- Export selected cells **(Table Options | Export…)** as a dBASE Table file named LakeDepth1995.dbf.
- When asked if you want to add the table to your map, select Yes
If there were no errors but you cannot see LakeDepth1995.dbf in your Table of Contents, you need to switch to List By Source view
- Open LakeDepth1995.dbf **(R-click | Open)**
- Add a new field **(Table Options | Add Field)** and...
- set the name to Area
- type to float
- precision to 16
- scale to 1 and then click OK
- Calculate the surface area of LakeDepth1995 using the following equation, area = # of cells (count) * length of cell * width of cell
Hint #1: (R-click column to be calculated, choose Field Calculator… if asked about calculating outside an Editing session, click Yes)
Hint #2: the length and width of the cell comes from the cell size of the grid, since the cells are square, the values are the same. - Add a new field and...
- set the name to cell_vol
- type to float
- precision to 16
- scale to 1 and then click OK
- Calculate the volume per cell of LakeDepth1995 using the following equation: cell_vol = depth (i.e., Value) * length of cell * width of cell
- Add a new field and...
- set the name to total_vol
- type to float
- precision to 16
- scale to 1 and then click OK
- Calculate the total volume of LakeDepth1995 using the following equation: total_vol = volume per cell (cell_vol) * total number of cells (count)
You will need to perform this process twice more for 2003 and 2009, answer the part 2 questions, and submit both parts to Blackboard.