Random bin
This is a place for me to dump some of my uncategorized work, links to other great content creators, and other neat resources I’ve found along my way.
Dev tools
- A handy palette generator
- colorbrewer a great place to find good looking palette, needs no introduction
- color harmony identification is a tool to find
GIS Resources
- GIS lounge has compiled a nice cross section of links to open course-ware across the academic disciplines, and a few GIS-centric resources.
- Earth Lab has a massive amount of R and Python tutorials related to Earth Data Science.
- Hydroshare: “github for water” is a sad understatement of the capabilities of the platform, developed by the amazing folks at CUAHSI.
- OpenTOPO: A great clearinghouse and web toolset for topo data.
- OSGeoLive: Want to run free? This VM has every open tool you’ll need to do GIScience. For use in VirtualBox.
- Next, a set of three resources from UCGIS:
- A compiled list of resoures to expand classes which serve as a great spot to find tutorials and other class material
- Recorded webinars from the UCGIS Webinars & Workshops series.
- The UCGIS Body of Knowledge is a great place to start for your broad GIS questions or to get a broad overview on a particular topic.
- https://geoscripting-wur.github.io/, A very neat implementation of a class.
- Geospatial Analysis—A comprehensive guide (6th edition) by de Smith, M. J., M. F. Goodchild, P. A. Longley (2018) may serve as a great guide to use as a course book should you want one.
- Finally, the official list of Google Earth Engine tutorials is a great place to start your self guided introduction to the platform.
Next, a few R specific/centric resources:
- Tutorials covering a nice cross section of social GIS from the Center for Spatial Data Science (CSDS)
- An R based introduction to Geographic Information Science from Mike
These R enabled books are excellent resources:
- Big Book of R compiled by Oscar Baruffa is a great catchall to start your R exploration
- Intro to GIS and Spatial Analysis by Manuel Gimond
- Geocomputation with R by Robin Lovelace, Jakub Nowosad & Jannes Muenchow
- An incomplete version of Data Visualization: A practical introduction by Kieran Healy
- Spatial Data Science by Edzer Pebesma and Roger Bivand
- Using Spatial Data with R by Claudia A Engel
- r-statistics.co by Selva Prabhakaran
- Web Application Development with R Using Shiny by Chris Beeley and Shitalkumar R. Sukhdeve
- R for Data Science by Garrett Grolemund
- blogdown: Creating Websites with R Markdown by Yihui Xie, Amber Thomas, and Alison Presmanes Hill
Fun folks
- First, a few from John Nelson, a phenomenal cartographer and tutorial writer.
- Mike Johnson: A co-conspirator, data wizard, and all around great dude.
- hydroblog from Josh Erickson has a neat assortment of his work for the US forest service (check out his github as well).
- ESRI educational manager Joseph Kerski, and the Spatial Reserves blog are a great example of what a skilled and broadly trained geographer is capable of accomplishing.
Neat youtubes
- 3Blue1Brown is absolutely amazing. I wish this was available when I was sitting through math, and consider this mandatory viewing.
- The Surface Dynamics Modeling Lab out of the University of Alabama has an excellent archive of invited speaker talks and tutorials.
- PBS Space Time puts together physics-centric videos that revolve around, well, space and time.
- Numberphile covers interesting or otherwise unique aspects of math in a casual but informative way.
- My inner film major loves the overly analyzed aspects film covered in Every Frame a Painting.
- Capitan Disillusion does a phenomenal job explaining digital concepts and demonstrating how modern CGI can be used.
- The CUAHSI channel features many of their recorded webinars.
- Finally, Apetor can teach us all a little something about the wonder of life.
Thesis leftovers
- A misguided attempt at a website for my masters. Placed here more to remind me to do something with it one of these days: https://sites.google.com/site/globalsnowobservatory/
- A post about Mann Kendall and Sens slope in GEE from me. At some point I’ll get around to doing something with this too.
Cartographic line data: http://www.projectlinework.org/
Base imagery: https://www.naturalearthdata.com/downloads/10m-raster-data/
Topo resources: http://www.earthpoint.us/TopoMap.aspx
Water resources: https://www.hydroshare.org/landingPage/
Earth as art: https://eros.usgs.gov/image-gallery/earth-as-art
- GEE slides: https://docs.google.com/presentation/d/e/2PACX-1vS6dyB5JjpXAUpQGOj7gzlgpGxGBjAWLqkwizxEbblkzwzNjgPX-xDe69hvSJ_hxAv529ojzyeT1GVD/pub?slide=id.g7a554f672f_1_148
- Other useful slide decks: https://agu2019.earthoutreach.org/booth
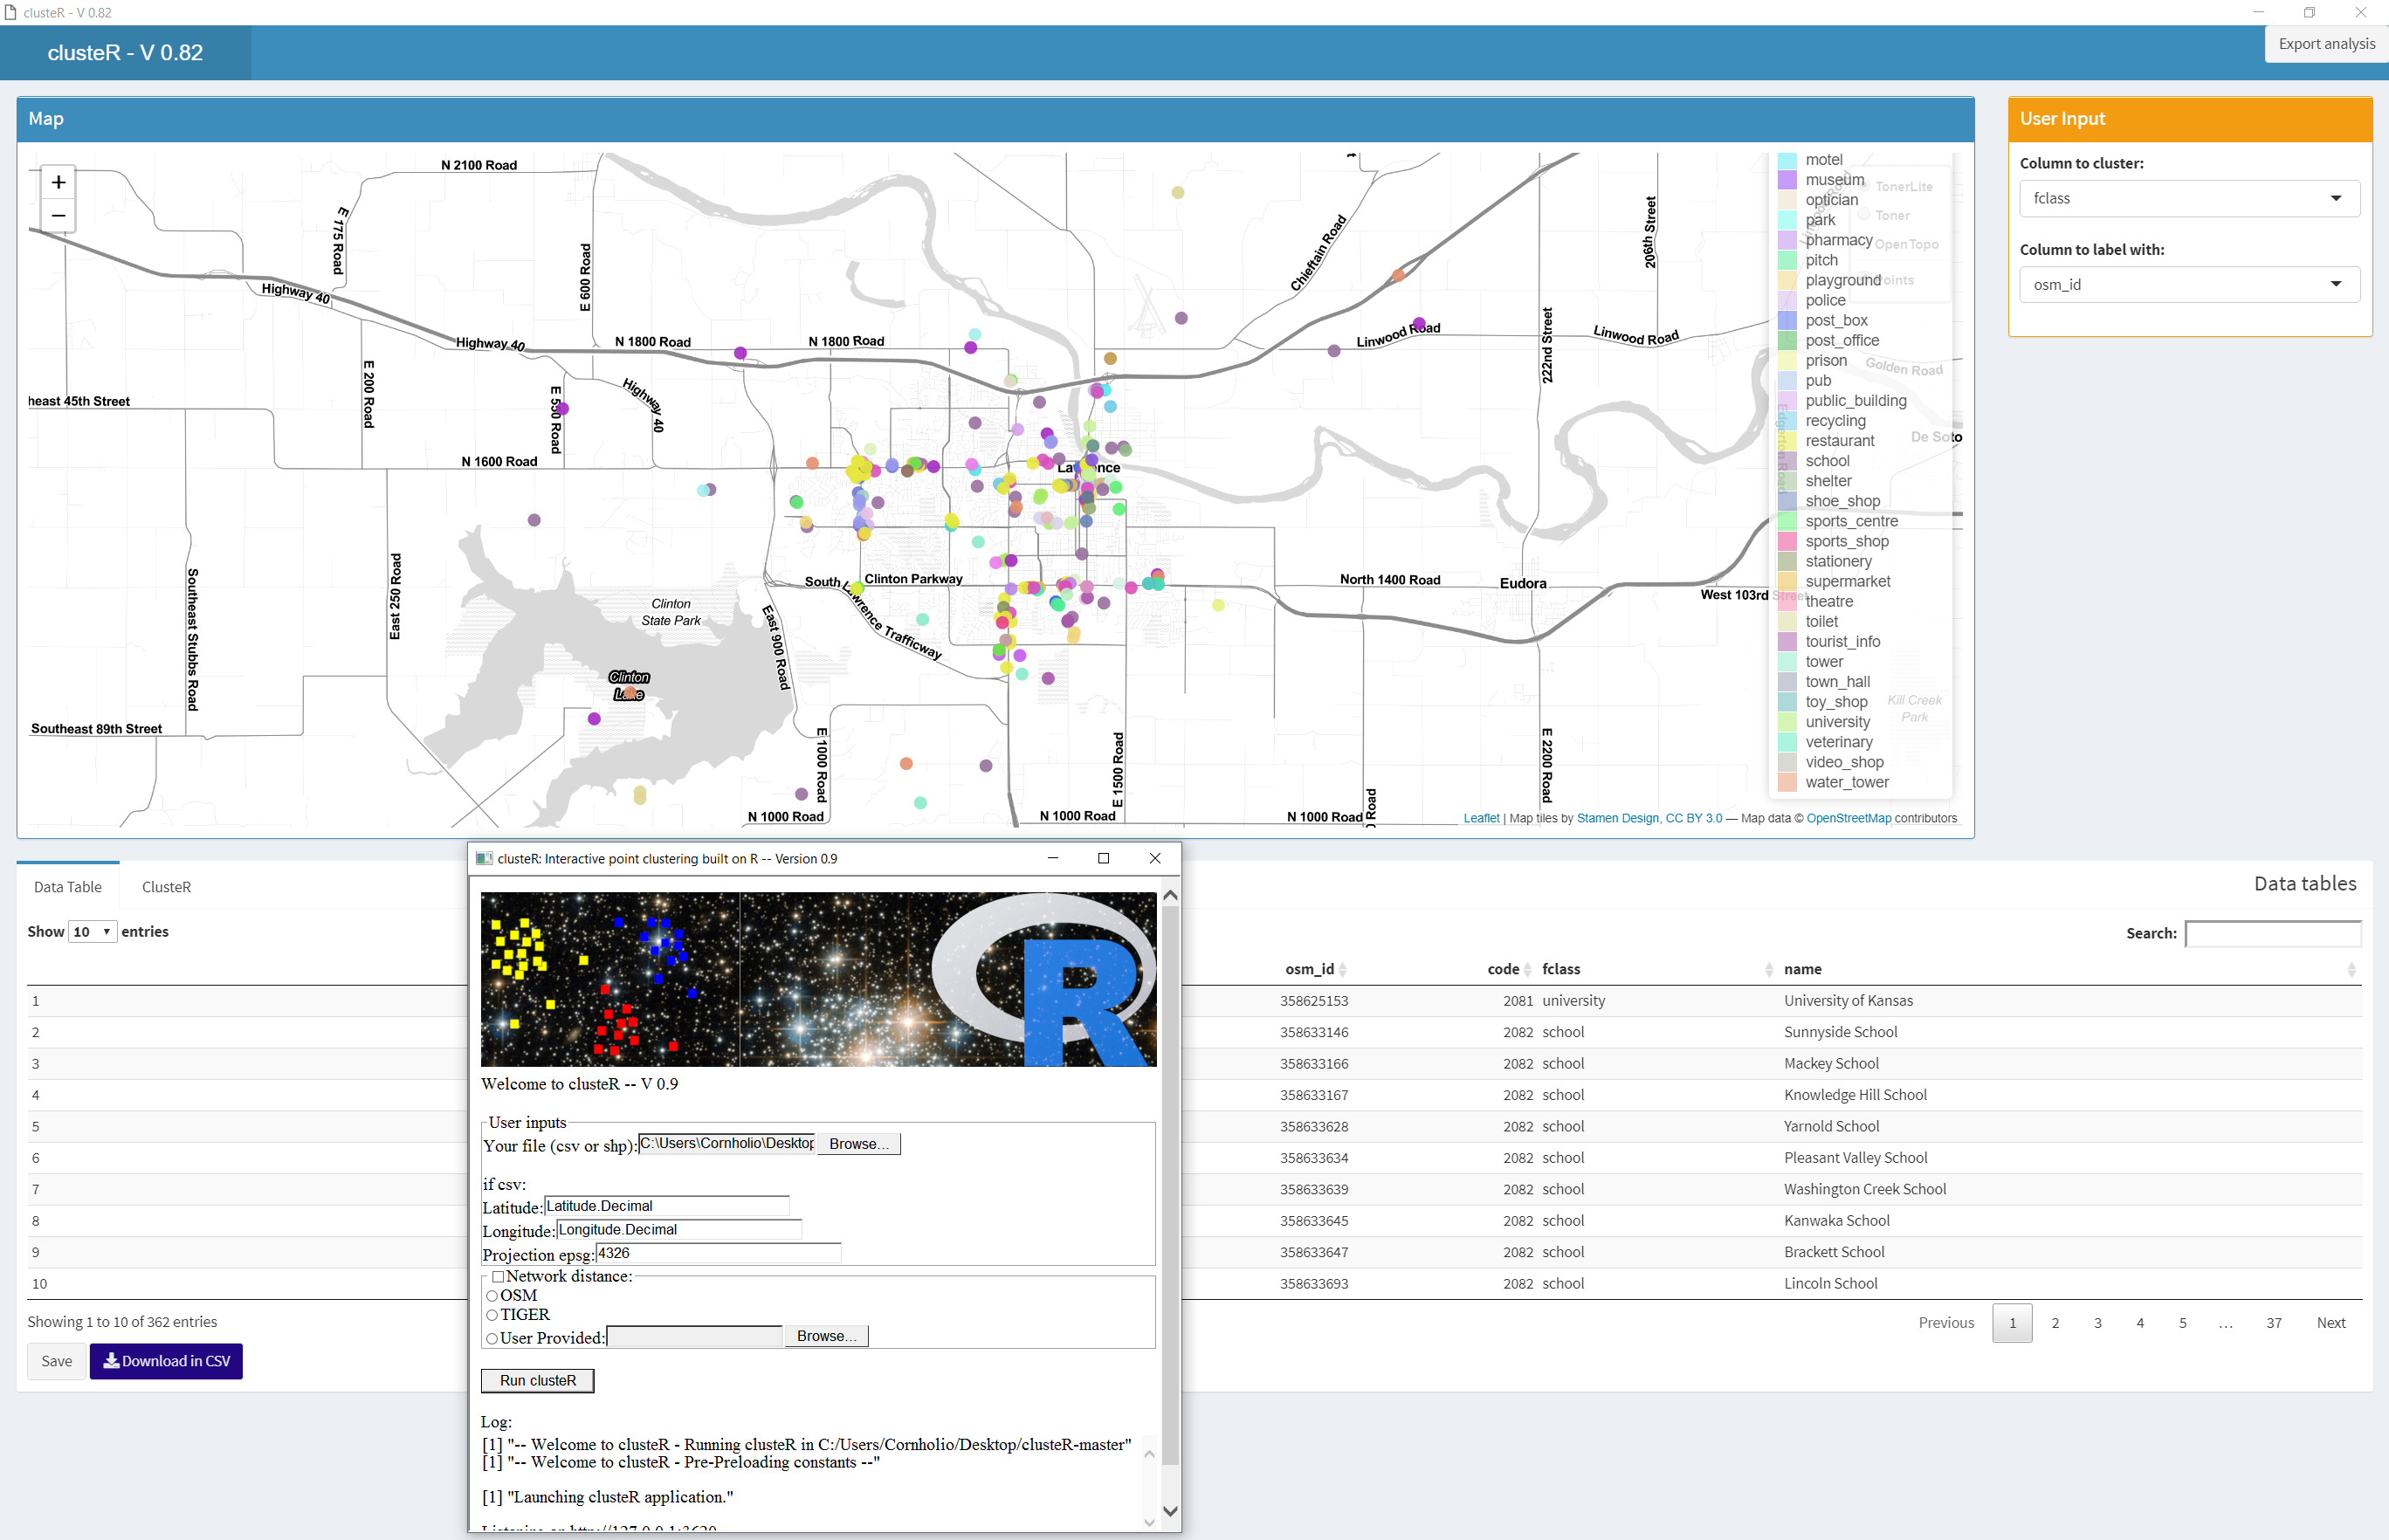
See the github: https://github.com/JimColl/clusteR or it’s companion on my website: https://jimcoll.github.io/random/
About:
A tool to add points to a map from csv or shapefile, and interactively cluster them as you see fit, this GUI driven, geographic database display and clustering application built is built on R. Is also a nearly minimal example of how to tie map and database together, how reactive shiny elements work, and how to print dashboards. A project that grew out of a request to see a database from a geographic prospective, here is a FOSS implementation of GIS for people who don’t know or have the time to learn it.
Features
- GUI driven interface to select csv or shapefile database.
- Use drop downs how to cluster (currently broken), color, and label the points.
- Edit the table view of the database and optionally save the database back out.
- Click on a table entry to zoom to the location
- Fully reactive map and editing
How to run:
The “installation” of this is program is trivially easy by design and requires no permissions. To start the process:
- Download and unzip this repository using the green “Clone or download” button.
- Select a csv or a shapefile, enter the LAT LON and EPSG fields as necessary. Replace spaces with.
- and hit run!
A test dataset is included in the data folder. To “uninstall”, just delete the folder. Pandoc and PhantomJS are also installed, and may be removed through the add or remove programs system dialog and the user/AppData/Roaming folder respectively.
Known bugs:
- Selecting fields which are too long or numeric will currently kill the crab. To recover, close the window and re run the HTA.
- Map and data don’t wrap smoothly.
- Fly to (when you click on a row) will sometimes cause the server to lock up. To fix, zoom in a bit before attempting to fly.
- Legends can be too large for the window.
- Print button works but output is gross.
- Map legends are also not printed.
- Pandoc needs to restart after being installed, so attempting to print after the installation will break the server. This will only happen when you first run clusteR. To recover, close the window and re run the HTA.
- Editing the table is not fully tested.
- Shapefile editing broken.
A fun(?) section more for me than for anything else to showcase how grossly incompetent I am at actually getting a computer to do what I want.
mybbox <- raster::extent(sf::st_buffer(
	x=xx$mapindex.poly[subset(xx$address.point, eval(parse(text = names(xx$flood.grid)[timestep]))>0),][xx$mapindex.poly[subset(xx$address.point, eval(parse(text = names(xx$flood.grid)[timestep]))>0),]$`Index Label`==index,],
	dist=0.00005,
	nQuadSegs=1,
	endCapStyle="SQUARE",
	joinStyle="ROUND",
	mitreLimit=1,
	singleSide=FALSE))
The mapping side of FOSSFlood is a bit wild, but this line takes the lead. I needed a slightly larger bounding box from the index that a user wants to view so that I could fly to it. However, these indexes aren’t necessarily the same for each time step, so the subset got that eval(parse()) function, inside a buffer, and because it’s all temporary this made sense (at the time) to do in the single step you see here.
for x in np.nditer(branch_GRIDCODES_lookup):
	for y in np.array([[x]])[0][0][0].split(","):
		if int(y)==mat_num:
			branch_num = np.array([[x]])[0][0][1]
This chuck, called iteratively in a for loop, looks at all the grid codes for a given fldpln library and, for a given mat file returns the branch code for that mat file, all so I can eventually stich them together in a numpy array. I have a hate-love-hate relationship with Python….
if(SpaceSelectValue == "stdDev") {
      results = ee.ImageCollection(app.MODDef)
                  .select(stringSeperator,LCtoUse)
                  .map(function(image) {
        return image.reduceRegions({
          collection: AOI.geometry(),
          reducer: ee.Reducer.stdDev().group({
            groupField: 1,
            groupName: "code",
          }),
          scale: resultsScale
        }).map(function(f) {
          // Process the grouped results from list of dictionaries to dictionary.
          var dict = ee.List(f.get("groups")).map(function(group) {
            group = ee.Dictionary(group).combine(ee.Dictionary({code:99,stdDev:[null]}), false);
            var code = ee.Number(group.get("code")).format("code_%d");
            var stdDev = group.get("stdDev");
            return [code, stdDev];
          });
          dict = ee.Dictionary(dict.flatten());
          // Add a date property to each output feature.
          return f.set("date YYYY-MM-dd", image.date().format("YYYY-MM-dd"))
                  .set("system:time_start", image.date().millis())
                  .set(dict)
                  .set("groups", null);
        });
      });
A lot of my JavaScript is pretty repetitive as a result of my poor skills and a sub par understanding of client-server interactions. Although this isn’t the most egregious example, it is repeated in TEAM no less than 7 times with minor changes for each statistic of aggregation.